Ecmoho Ltd (NASDAQ:MOHO) is trading slightly lower by on Monday after news.
Market Action
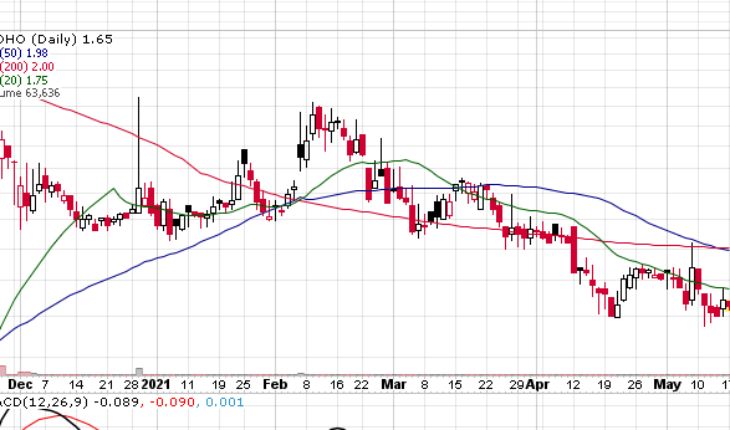
As of 1:39, MOHO stock slide 2.25% to $1.652. More than 63K shares have been traded hands. The stock opened at $1.68 and moved within a narrow range of $1.63-$1.68.
MOHO Issues News
ECMOHO Limited and Harbin Pharmaceutical Group Announce Joint Launch of New Iron Supplement Product
- MOHO announced today that on May 10, 2021, a new product, Puxue Oral Liquid, which is a supplement intended for use by children aged between one and 17, adults, pregnant women, and nursing mothers who suffer from iron and vitamin B12 deficiencies, is jointly launched by the Company and Harbin Pharmaceutical Group Co., Ltd. (“HPGC”).
- ECMOHO is primarily responsible for the packaging design and sales distribution of the new product.
- Iron and vitamin B12 deficiencies may lead to anemia, which may cause a series of health problems, including asthenia and exercise-induced asthma, as well as chronic brain hypoxia, which affects normal cognitive ability, and may negatively impact the body’s immune system.
- This new oral liquid supplement is designed to ameliorate iron and B12 deficiencies-induced health problems faced by many Chinese consumers.
Ms. Zoe Wang, Chairman and Chief Executive Officer of ECMOHO, stated: “In collaboration with HPGC, we launched this high-quality and effective iron and vitamin B12 supplement product to address the significant needs of people who suffer from symptoms caused by iron deficiency, and support their nutrition and health needs.”
Trader Notes
Share Information
| SHARES OUTSTANDING | 15.89 M |
| SHARE FLOAT (%) | – |
| % HELD BY INSTITUTIONS | 2.08 |
Recent Stock Performance
| 5-DAY PERF. | -5.60% |
| 1-MONTH PERF. | -4.51% |
| 3-MONTH PERF. | -43.03% |
| 6-MONTH PERF. | +20.58% |
| YTD PERF. | -26.58% |
| 1-YEAR PERF. | -55.23% |
Moving Averages
| +/- EMA(20) | 1.76 (-6.25%) |
| +/- SMA(50) | 1.98 (-16.67%) |
| +/- SMA(200) | 2.00 (-17.50%) |
Pivot Points
| Name | S3 | S2 | S1 | Pivot Points | R1 | R2 | R3 |
| Classic | 1.4600 | 1.5300 | 1.6100 | 1.6800 | 1.7600 | 1.8300 | 1.9100 |
| Fibonacci | 1.5300 | 1.5873 | 1.6227 | 1.6800 | 1.7373 | 1.7727 | 1.8300 |
Technical Indicators
| Symbol | Value | Result | Symbol | Value | Result |
| ADX | 19.9250 | Neutral | ATR14 | 0.1603 | |
| CCI20 | -67.0140 | Sell | Chaikin Money Flow | 0.0045 | Neutral |
| MACD | -0.1191 | Sell | Money Flow Index | 55.0385 | Sell |
| ROC | -9.1398 | Sell | RSI | 42.6046 | Buy |
| STOCH (14,3) | 28.5773 | Sell | STOCH RSI | 0.5414 | Neutral |
| UO | 43.3127 | Sell | Williams %R | -71.4227 | Neutral |
