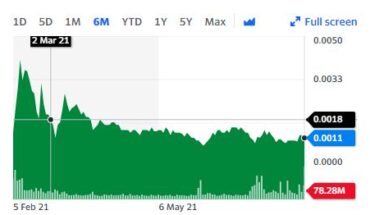
CBD Life Sciences (OTCMKTS:CBDL) is gaining momentum in early trading on Monday.
Market Action
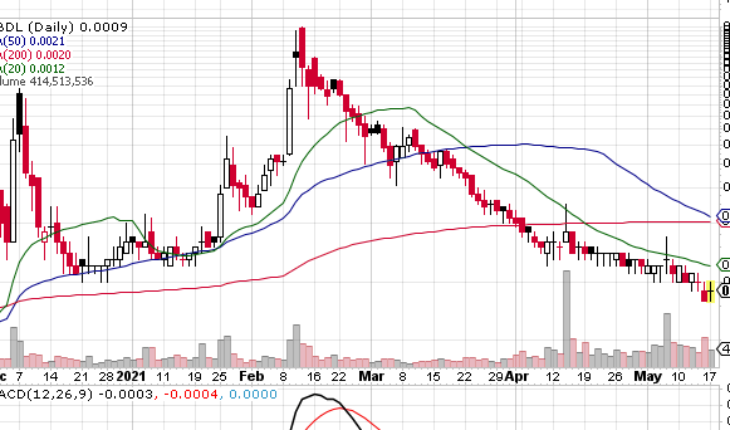
As of 10.25, CBDL stock is trading lower by 12.50% at $0.0009. Volume was 414 million shares, well above its 3-day moving average volume of 291 million shares.
CBDL Issues News
This morning, CBD Life Sciences released news. Here are the key points to watch:
CBD Life Sciences, Inc. (CBDL) Launches Top Selling Pain Cream & Gummies on its Amazon Store
- CBDL announced the launch of two new products on its Amazon Store Located at www.amazon.com/shops/lbcbioscienceinc.
- The company wanted to introduce the addition of its Hemp-based product line on the shopping giant, Amazon.com, in a move that emphasizes the importance of hemp in the future of both LBC Bioscience Inc. and the nutritional hemp market which is “blowing up” around the world.
- CBD Life Sciences Inc. is very proud to showcase an addition of two more products on Amazon.
- These two products are the famous 1200MG Pain Relief Cream we have had on our e-commerce website for a very long time and the other product being the tasty yummy gummy bears coming in either 150MG or 350MG.
President & CEO Lisa Nelson states “We have been trying to get more and more products up on our Amazon Store and we will keep updating the shareholders as we go along!”
Trader Notes
Share Information
| SHARES OUTSTANDING | 0.56 M |
| SHARE FLOAT (%) | – |
| % HELD BY INSTITUTIONS | 51.79 |
Recent Stock Performance
| 5-DAY PERF. | -25.00% |
| 1-MONTH PERF. | -40.00% |
| 3-MONTH PERF. | -90.63% |
| 6-MONTH PERF. | +80.00% |
| YTD PERF. | -43.75% |
| 1-YEAR PERF. | -25.00% |
Moving Averages
| +/- EMA(20) | 0.0013 (-30.77%) |
| +/- SMA(50) | 0.0021 (-57.14%) |
| +/- SMA(200) | 0.0020 (-55.00%) |
| Pivot Points | |||||||
| Name | S3 | S2 | S1 | Pivot Points | R1 | R2 | R3 |
| Classic | 0.0005 | 0.0007 | 0.0007 | 0.0009 | 0.0009 | 0.0011 | 0.0011 |
| Fibonacci | 0.0007 | 0.0007 | 0.0008 | 0.0009 | 0.0009 | 0.0010 | 0.0011 |
| Camarilla | 0.0007 | 0.0008 | 0.0008 | 0.0009 | 0.0008 | 0.0008 | 0.0009 |
| Woodie | 0.0006 | 0.0007 | 0.0008 | 0.0009 | 0.0010 | 0.0011 | 0.0012 |
| DeMark | – | – | 0.0007 | 0.0009 | 0.0009 | – |
| Technical Indicators | |||||
| Symbol | Value | Result | Symbol | Value | Result |
| ADX | 29.0979 | Sell | ATR14 | 0.0006 | |
| CCI20 | -189.0411 | Sell | Chaikin Money Flow | 0.1499 | Buy |
| MACD | -0.0007 | Sell | Money Flow Index | 21.1656 | Buy |
| ROC | -33.3333 | Sell | RSI | 40.2433 | Sell |
| STOCH (14,3) | 0.0000 | OverSold | STOCH RSI | 0.0000 | OverSold |
| UO | 46.7594 | Sell | Williams %R | -100.0000 | OverSold |
