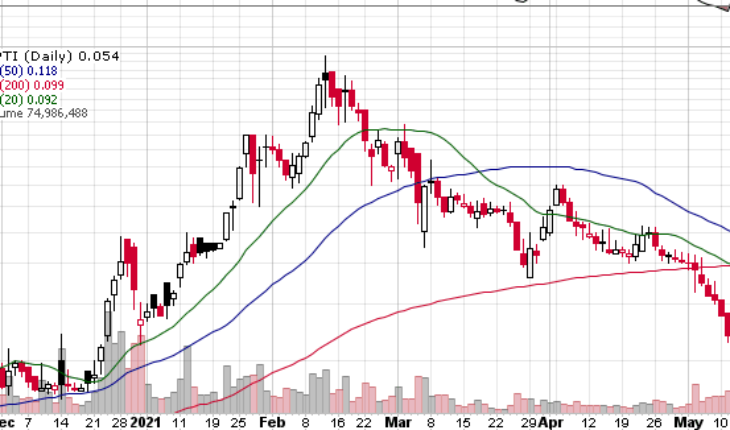
Optec International Inc (OTCMKTS:OPTI) is down again in Monday’s trading session. The stock may have some support here. This is the area the stock broke out from at the end of 2020. Lets hope so, the stock is down 80% in the last three months.
Market Action
As of 2:45, OPTI stock is trading at $0.0542, down by 21.52% or $0.0148. The fall has been driven by a hugh volume of 74.95 million, well above its 30-day average volume of 19.90 million shares. The stock opened at $0.0635 and moved within a narrow range of 0.0503-0.0690.
OPTI Releases Multiple Updates
This morning Optec International release a couple of press release. Here are the key highlights:
1. OPTEC International, Inc. Restores Fuel Maximizer Production in Response to Recent Increase in Orders
- OPTEC International, today announced the company is reviving production of the Fuel Maximizer product lines as a result of a noticeable increase in orders for the Fuel Saving products.
- The company has a significant supply of components on hand and is staring assembly right away.
- The demand appears to be as a result of a nationwide increase in fuel prices which affects the transportation, travel and manufacturing industry as a whole.
2. Rafina Innovations Inc. Announces Brand-New Website and Exclusive Distributor Agreement with OPTEC International Inc.
- OPTI officially announced the launch of its brand-new website and domain, designed with a user-friendly navigation, updated with the latest information and topics about its products and services.
- Its company goal with the new website is to provide its customers and shareholders an easier way to learn about the company.
Trader Notes
Share Information
| SHARES OUTSTANDING | 1,710.15 M |
| SHARE FLOAT (%) | 1,608.95 M (94.08%) |
| % HELD BY INSTITUTIONS | – |
Recent Stock Performance
| 5-DAY PERF. | -21.34% |
| 1-MONTH PERF. | -50.77% |
| 3-MONTH PERF. | -84.16% |
| 6-MONTH PERF. | +2.26% |
| YTD PERF. | -18.62% |
| 1-YEAR PERF. | +7642.86% |
Moving Averages
| +/- EMA(20) | 0.0884 (-38.69%) |
| +/- SMA(50) | 0.1182 (-54.15%) |
| +/- SMA(200) | 0.0989 (-45.20%) |
Pivot Points
| Name | S3 | S2 | S1 | Pivot Points | R1 | R2 | R3 |
| Classic | 0.0536 | 0.0581 | 0.0635 | 0.0680 | 0.0734 | 0.0779 | 0.0833 |
| Fibonacci | 0.0581 | 0.0618 | 0.0642 | 0.0680 | 0.0717 | 0.0741 | 0.0779 |
Technical Indicators
| Symbol | Value | Result | Symbol | Value | Result |
| ADX | 23.9298 | Neutral | ATR14 | 0.0216 | |
| CCI20 | -118.6703 | Sell | Chaikin Money Flow | -0.2250 | Sell |
| MACD | -0.0243 | Sell | Money Flow Index | 17.5888 | OverSold |
| ROC | -35.2113 | Sell | RSI | 36.8046 | Buy |
| STOCH (14,3) | 21.8472 | Buy | STOCH RSI | 0.6328 | Neutral |
| UO | 37.8833 | Buy | Williams %R | -78.1528 | Neutral |


