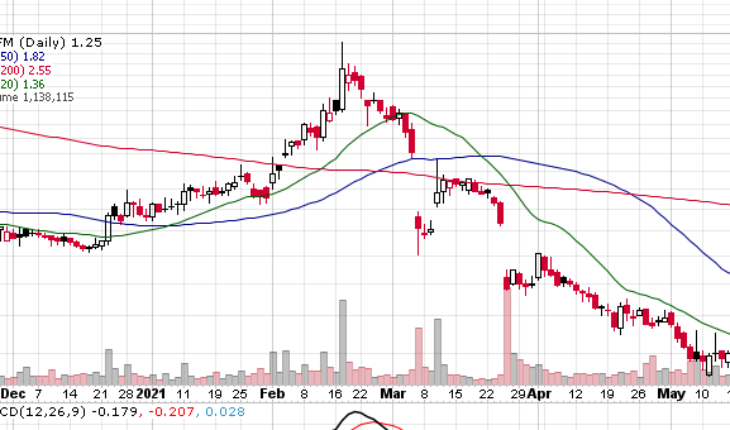
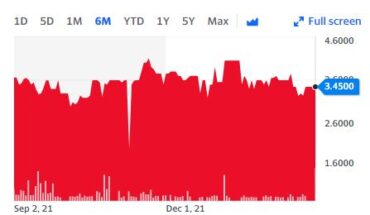
Evofem Biosciences Inc (NASDAQ:EVFM) is trading slightly higher after the news. Overall EVFM has been trending lower for months. There does seem to be a little buying coming into the stock, and if it could trade above 1.30, there may be the possibility of a little rally.
Market Action
As of 2:15, EVFM is trading at 1.26 up .005 adding less than 1% on the day. Volume is 1.1 million shares well below its average of 3.6 million a day. EVFM opened at $1.23 and has traded within a range of $1.21-$1.28.
EVFM Issues News
New Data on EVO100 for the Prevention of Chlamydia and Gonorrhea in Women to be Presented at ISPOR 2021
- EVFM announced that new research on its investigational drug EVO100 for the prevention of chlamydia and gonorrhea in women will be highlighted in a poster presentation at the annual meeting of the Professional Society for Health Economics and Outcomes Research, Virtual ISPOR 2021, which will be held May 17 to 20, 2021.
- Qualitative research was conducted among 21 women with previous experience with EVO100.
- Participant interviews explored the concepts of sexual satisfaction and understandability of the Female Sexual Function Index (FSFI) global sexual satisfaction and product satisfaction questions in AMPREVENCE.
- Patients were also asked about the importance of a microbicide to protect against infection and understanding the impact on sexual satisfaction.
- Participants reported that adherence with use of EVO100 was related to product satisfaction and the impact on global sexual satisfaction as well as efficacy.
- All participants indicated that this information was important to know for women considering a microbicidal vaginal gel like EVO100.
Trader Notes
Share Information
| SHARES OUTSTANDING | 102.84 M |
| SHARE FLOAT (%) | 99.99 M (97.23%) |
| % HELD BY INSTITUTIONS | 32.19 |
Recent Stock Performance
| 5-DAY PERF. | +3.72% |
| 1-MONTH PERF. | -19.55% |
| 3-MONTH PERF. | -74.28% |
| 6-MONTH PERF. | -41.63% |
| YTD PERF. | -47.93% |
| 1-YEAR PERF. | -76.05% |
Moving Averages
| +/- EMA(20) | 1.39 (-10.07%) |
| +/- SMA(50) | 1.82 (-31.32%) |
| +/- SMA(200) | 2.55 (-50.98%) |
Pivot Points
| Name | S3 | S2 | S1 | Pivot Points | R1 | R2 | R3 |
| Classic | 1.0900 | 1.1300 | 1.1900 | 1.2300 | 1.2900 | 1.3300 | 1.3900 |
| Fibonacci | 1.1300 | 1.1682 | 1.1918 | 1.2300 | 1.2682 | 1.2918 | 1.3300 |
Technical Indicators
| Symbol | Value | Result | Symbol | Value | Result |
| ADX | 28.0399 | Sell | ATR14 | 0.1647 | |
| CCI20 | -93.1946 | Sell | Chaikin Money Flow | -0.3513 | Sell |
| MACD | -0.3278 | Sell | Money Flow Index | 36.9224 | Buy |
| ROC | -12.5874 | Sell | RSI | 30.6566 | Buy |
| STOCH (14,3) | 30.2326 | Buy | STOCH RSI | 1.0000 | OverBought |
| UO | 37.4792 | Buy | Williams %R | -69.7674 | Neutral |
