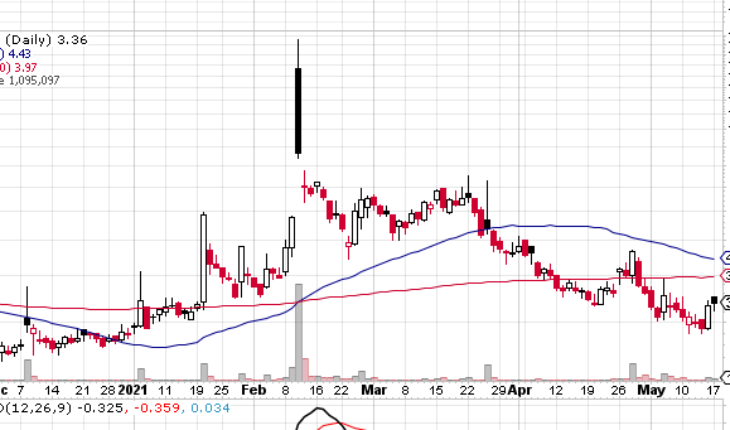
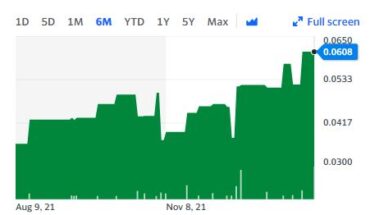
Cancer Genetics Inc (NASDAQ:VYNT) is moving up in pre-open session after announcing quarterly results. The stock was up higher in pre-market trading, but has settled back a bit. The fact it traded above yesterday’s close could hint a bounce may be in the cards.
Market Action
As of 8:05, VYNT stock surged 4.17% to $3.50. So far more than 12K shares have exchanged hands.
VYNT Reports First Quarter 2021 Results
Vyant Bio Reports First Quarter 2021 Results and Provides Strategic Business Update
- Total revenues increased 32%, or $54 thousand, to $222 thousand for the three months ended March 31, 2021, as compared with $168 thousand for the three months ended March 31, 2020.
- Research and development expenses decreased by 19%, or $189 thousand to $820 thousand for the three months ended March 31, 2021 from $1.0 million for the three months ended March 31, 2020.
- Cost of goods sold – service aggregated $89 thousand and $132 thousand, respectively, for the three months ended March 31, 2021 and 2020, resulting in a cost of goods sold of 77% and 97%, respectively, of service revenues.
Trader Notes
Share Information
| SHARES OUTSTANDING | 28.98 M |
| SHARE FLOAT (%) | 24.68 M (85.15%) |
| % HELD BY INSTITUTIONS | 2.14 |
Recent Stock Performance
| 5-DAY PERF. | +8.39% |
| 1-MONTH PERF. | -7.95% |
| 3-MONTH PERF. | -48.70% |
| 6-MONTH PERF. | +47.37% |
| YTD PERF. | +21.30% |
| 1-YEAR PERF. | +18.73% |
Moving Averages
| +/- EMA(20) | 3.48 (-3.45%) |
| +/- SMA(50) | 4.43 (-24.15%) |
| +/- SMA(200) | 3.97 (-15.37%) |
Pivot Points
| Name | S3 | S2 | S1 | Pivot Points | R1 | R2 | R3 |
| Classic | 1.1167 | 1.1433 | 1.1867 | 1.2133 | 1.2567 | 1.2833 | 1.3267 |
| Fibonacci | 1.1433 | 1.1701 | 1.1866 | 1.2133 | 1.2401 | 1.2566 | 1.2833 |
Technical Indicators
| Symbol | Value | Result | Symbol | Value | Result |
| ADX | 16.7966 | Neutral | ATR14 | 0.1132 | |
| CCI20 | -71.3152 | Sell | Chaikin Money Flow | -0.1565 | Sell |
| MACD | -0.0840 | Sell | Money Flow Index | 68.2670 | Sell |
| ROC | -8.8889 | Sell | RSI | 43.9559 | Buy |
| STOCH (14,3) | 32.6923 | Neutral | STOCH RSI | 0.9749 | OverBought |
| UO | 50.4530 | Sell | Williams %R | -67.3077 | Neutral |
