Green Globe International, Inc. (OTCMKTS:GGII) is bouncing a bit today. Will it continue?
Market Action
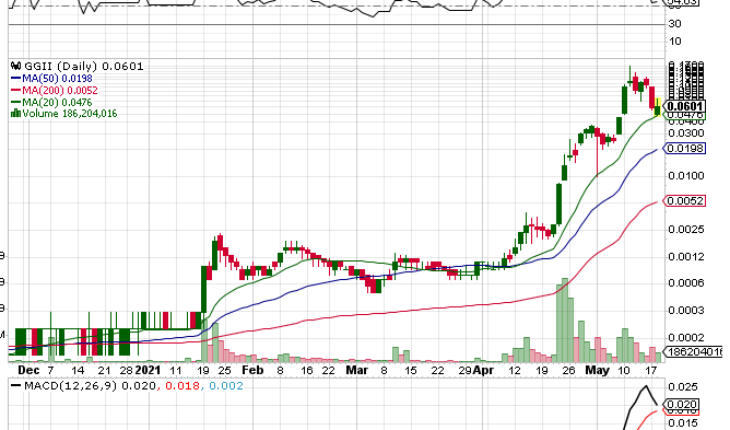
As of noon, GGII is trading at .0619 up 6.3% on the day. Volume is 192 million shares on 5183 trades. Trading Opened at .0495 and has ranged between .048 and .0729.
GGII has been a very active momentum play for the last few weeks since management changed and the company filed its last tow years quoartly and yearly financials.
Is GGII Overbought? What do the technicals tell us?
| Symbol | Value | Result | Symbol | Value | Result |
|---|---|---|---|---|---|
| ADX | 33.1148 | Sell | ATR14 | 0.0228 | |
| CCI20 | 52.5345 | Buy | Chaikin Money Flow | 0.1984 | Buy |
| MACD | 0.0226 | Buy | Money Flow Index | 68.5750 | Sell |
| ROC | 75.3012 | Buy | RSI | 54.0742 | Sell |
| STOCH (14,3) | 30.5256 | Sell | STOCH RSI | 0.0000 | OverSold |
| UO | 47.5515 | Sell | Williams %R | -69.4744 | Neutral |
Moving Averages
| Period | MA10 | MA20 | MA50 | MA100 | MA200 |
|---|---|---|---|---|---|
| Simple | 0.0706 Sell (-17.52%) | 0.0447 Buy (30.19%) | 0.0186 Buy (212.27%) | 0.0097 Buy (499.51%) | 0.0049 Buy (1081.13%) |
| Exponential | 0.0735 Sell (-20.78%) | 0.0541 Buy (7.68%) | 0.0292 Buy (99.32%) | 0.0166 Buy (251.10%) | 0.0090 Buy (548.59%) |
Pivot Points
| Name | S3 | S2 | S1 | Pivot Points | R1 | R2 | R3 |
|---|---|---|---|---|---|---|---|
| Classic | -0.0017 | 0.0268 | 0.0425 | 0.0710 | 0.0867 | 0.1152 | 0.1309 |
| Fibonacci | 0.0268 | 0.0437 | 0.0541 | 0.0710 | 0.0879 | 0.0983 | 0.1152 |


