XpresSpa Group Inc (NASDAQ:XSPA) continues to move higher in early trading on Tuesday.
Market Action
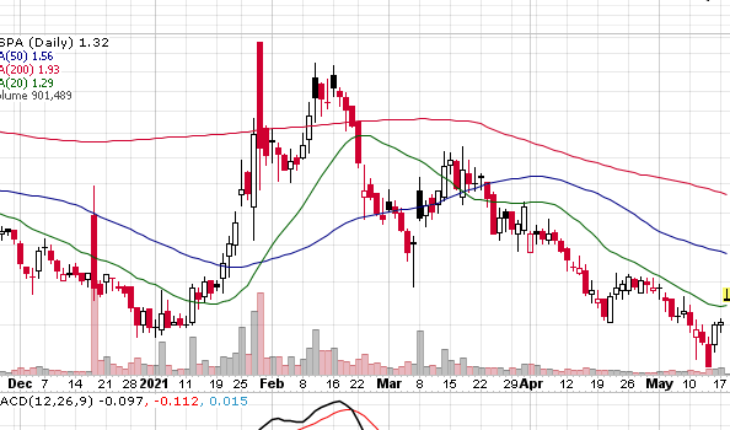
As of 9:48, XSPA is trading at $1.342 up .132, gaining 11%. So far more than 3.23 million shares have exchanged hands. The stock opened at $1.32 and moved within a range of $1.3000 -1.3700
XSPA Releases Q1 Earnings
Neptune Wellness Solutions Inc. Announces Board of Directors Update
- Reported revenue during the three months ended March 31, 2021 was $8.5 million compared to $7.7 million in the corresponding period in 2020.
- Gross profit was $4.4 million compared to $.6 million in the prior year first quarter, primarily due to higher revenue and the impact of 2020 cost of sales.
- Operating loss from operations decreased to $0.9 million compared to $3.9 million in the prior year first quarter, primarily due to higher revenue.
- Net loss attributable to common shareholders was $1.1 million compared to net loss attributable to common shareholders of $10.6 million in the prior year first quarter, primarily due to higher interest expense, warrant revaluations, and cost of goods sold in 2020.
- As of March 31, 2021, the Company had cash and cash equivalents, excluding restricted cash, of $102.6 million, total current assets of $107.8 million and total current liabilities of $13.8 million.
Trader Notes
Share Information
| SHARES OUTSTANDING | 105.31 M |
| SHARE FLOAT (%) | 104.16 M (98.91%) |
| % HELD BY INSTITUTIONS | 13.20 |
Recent Stock Performance
| 5-DAY PERF. | +14.41% |
| 1-MONTH PERF. | -0.74% |
| 3-MONTH PERF. | -48.28% |
| 6-MONTH PERF. | -19.16% |
| YTD PERF. | +13.45% |
| 1-YEAR PERF. | -5.00% |
Moving Averages
| +/- EMA(20) | 1.29 (+4.65%) |
| +/- SMA(50) | 1.56 (-13.46%) |
| +/- SMA(200) | 1.93 (-30.05%) |
Pivot Points
| Name | S3 | S2 | S1 | Pivot Points | R1 | R2 | R3 |
| Classic | 1.1167 | 1.1433 | 1.1767 | 1.2033 | 1.2367 | 1.2633 | 1.2967 |
| Fibonacci | 1.1433 | 1.1663 | 1.1804 | 1.2033 | 1.2263 | 1.2404 | 1.2633 |
Technical Indicators
| Symbol | Value | Result | Symbol | Value | Result |
| ADX | 26.2930 | Buy | ATR14 | 0.1260 | |
| CCI20 | -64.0262 | Sell | Chaikin Money Flow | -0.0081 | Neutral |
| MACD | -0.1316 | Sell | Money Flow Index | 32.4804 | Sell |
| ROC | -12.9496 | Sell | RSI | 42.3745 | Buy |
| STOCH (14,3) | 45.0000 | Buy | STOCH RSI | 1.0000 | OverBought |
| UO | 48.1747 | Sell | Williams %R | -55.0000 | Neutral |


