Bantec Inc (OTCMKTS:BANT) is moving up sharply on Tuesday. Will the momentum continue?
Market Action
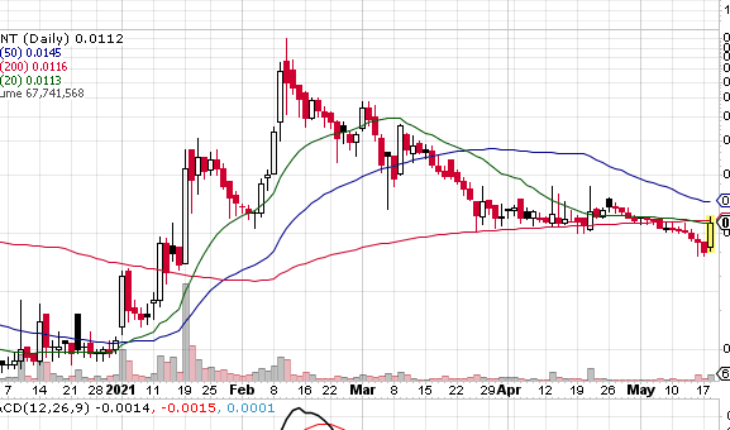
As of 1:11, BANT stock soared 40% or $0.0032 to $0.0112. The stock has seen a total volume of 67.85 million shares – 2.20X its average volume. The stock opened at $0.0085 and moved in a wide range of $0.0081 – 0.0122.
BANT Issues Acquisition News
Bantec Acquires USPTO Patent for Drone Operated Package Delivery Receptacle
- BANT announced the acquisition of a drone operated delivery receptacle utility patent (issued by the USPTO) for package delivery.
- The Delivery Drones Market reached the USD 2 billion mark in 2020 and is projected to reach USD 5.6 billion by 2026 according to a Mordor Intelligence report. The shift to contactless delivery due to COVID-19 has significantly sped up the delivery drone market movement.
Michael Bannon, Bantec’s Chairman and CEO stated: “when I first entered into the drone business, and acquired my FAA drone pilot license, I kept my eye on the drone delivery market. While the more general drone industry itself has grown rapidly, the delivery segment lagged behind. During these ‘growing pains’ we have strategically positioned Bantec to take advantage of the drone delivery market move from niche to mainstream. We are at the cusp of this drone delivery market shift and see this USPTO patent acquisition as another major step for Bantec to become a major player in the upcoming drone package delivery market. Our patented technology will ensure safe and secure drone package delivery to businesses and residential homes throughout the United States and possibly throughout the world. “
Trader Notes
Share Information
| SHARES OUTSTANDING | 1,579.28 M |
| SHARE FLOAT (%) | 1,323.94 M (83.83%) |
| % HELD BY INSTITUTIONS | 0.00 |
Recent Stock Performance
| 5-DAY PERF. | +7.69% |
| 1-MONTH PERF. | -2.61% |
| 3-MONTH PERF. | -73.95% |
| 6-MONTH PERF. | +348.00% |
| YTD PERF. | +300.00% |
| 1-YEAR PERF. | +86.67% |
Moving Averages
| +/- EMA(20) | 0.0111 (+0.90%) |
| +/- SMA(50) | 0.0145 (-22.76%) |
| +/- SMA(200) | 0.0116 (-3.45%) |
Pivot Points
| Name | S3 | S2 | S1 | Pivot Points | R1 | R2 | R3 |
| Classic | 0.0060 | 0.0068 | 0.0074 | 0.0082 | 0.0088 | 0.0096 | 0.0102 |
| Fibonacci | 0.0068 | 0.0073 | 0.0077 | 0.0082 | 0.0087 | 0.0091 | 0.0096 |
Technical Indicators
| Symbol | Value | Result | Symbol | Value | Result |
| ADX | 35.3292 | Buy | ATR14 | 0.0032 | |
| CCI20 | -178.2755 | Sell | Chaikin Money Flow | -0.2069 | Sell |
| MACD | -0.0030 | Sell | Money Flow Index | 6.7403 | OverSold |
| ROC | -33.3333 | Sell | RSI | 43.8432 | Sell |
| STOCH (14,3) | 6.7797 | OverSold | STOCH RSI | 0.0000 | OverSold |
| UO | 37.1341 | Sell | Williams %R | -93.2203 | OverSold |


