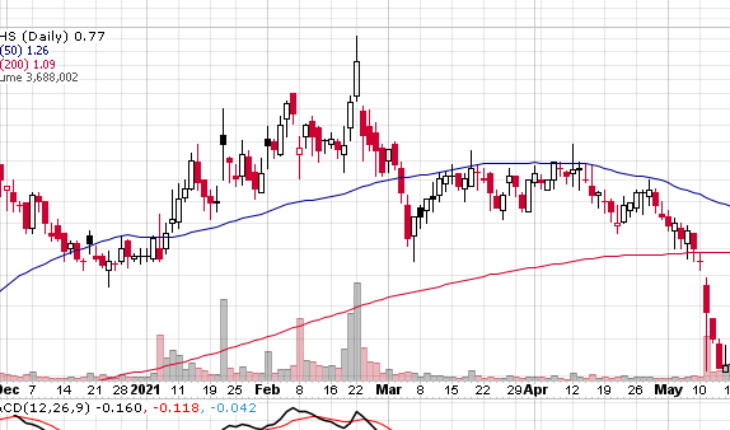
Senmiao Technology Ltd (NASDAQ:AIHS) is in down 50% in the last few weeks. Will it rebound? THe stock has had three small up days which is a start but feels like it may head lower anyway.
Market Action
AIHS stock closed higher by 0.036 or 4.93% to close at $0.766 on Tuesday. Total volume was 3.66 million shares, above its average volume of 1.96 million shares. The stock moved in a range of $ 0.7251 – 0.7789 after opening at $0.73.
AIHS Released News Last Week
Senmiao Technology Announces Closing of $6.5 Million Registered Direct Offering
- AIHS announced that it has closed a registered direct offering with certain institutional investors (the “Investors”) of 5,531,916 of its shares of common stock at a price of $1.175 per share (at-the-market under the Nasdaq rules) for aggregate gross proceeds of approximately $6.5 million.
- In addition, the Company issued warrants to the Investors to purchase a total of 5,531,916 shares of common stock at a purchase price of $1.05 per share. The warrants have a term of five years and are exercisable at any time on or after the issue date.
- The Company has approximately 55.4 million shares of common stock outstanding after the offering. Senmiao intends to use the net proceeds from the offering for working capital and other general corporate purposes.
- FT Global Capital, Inc. acted as the exclusive placement agent for the offering. Pryor Cashman LLP acted as counsel to the Company and Schiff Hardin LLP acted as counsel to the placement agent in connection with the placement.
Trader Notes
Share Information
| SHARES OUTSTANDING | 55.41 M |
| SHARE FLOAT (%) | 39.28 M (70.90%) |
| % HELD BY INSTITUTIONS | 0.81 |
Recent Stock Performance
| 5-DAY PERF. | -12.76% |
| 1-MONTH PERF. | -42.84% |
| 3-MONTH PERF. | -51.52% |
| 6-MONTH PERF. | -28.41% |
| YTD PERF. | -28.41% |
| 1-YEAR PERF. | +118.86% |
Moving Averages
| +/- EMA(20) | 1.03 (-25.24%) |
| +/- SMA(50) | 1.26 (-38.89%) |
| +/- SMA(200) | 1.09 (-29.36%) |
Pivot Points
| Name | S3 | S2 | S1 | Pivot Points | R1 | R2 | R3 |
| Classic | 0.6805 | 0.7028 | 0.7344 | 0.7567 | 0.7883 | 0.8106 | 0.8422 |
| Fibonacci | 0.7028 | 0.7234 | 0.7361 | 0.7567 | 0.7773 | 0.7900 | 0.8106 |
Technical Indicators
| Symbol | Value | Result | Symbol | Value | Result |
| ADX | 21.8778 | Neutral | ATR14 | 0.1176 | |
| CCI20 | -115.4247 | Sell | Chaikin Money Flow | 0.0155 | Neutral |
| MACD | -0.1671 | Sell | Money Flow Index | 11.4691 | OverSold |
| ROC | -37.7236 | Sell | RSI | 26.4355 | OverSold |
| STOCH (14,3) | 8.6154 | OverSold | STOCH RSI | 0.4121 | Buy |
| UO | 40.5431 | Sell | Williams %R | -91.3846 | OverSold |


