Vinco Ventures Inc (NASDAQ:BBIG) ended slightly lower on Tuesday. Was that the end of the recent up move? The stock is trading lower pre market Wednesday.
Market Action
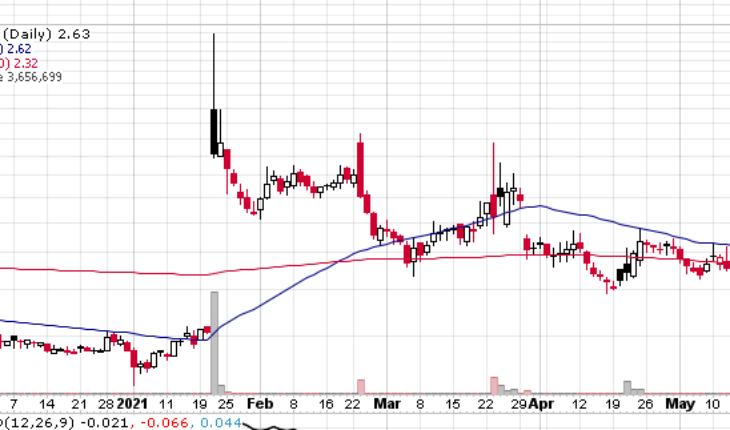
On Tuesday, BBIG moved down by 0.75% and end the session at $2.63. Total volume was 3.65 million shares, compared to its average volume of 3.35 million shares. The stock opened at $2.64 and moved within a wide range of $ 2.5300 – 2.9200.
BBIG Recent News
Vinco Ventures Announces Two Million Dollar Pre-Sale of the First of Three Exclusive Emmersive-NFTs (E-NFTs)
- BBIG announced its subsidiary, EVNT Platform, LLC (d/b/a Emmersive Entertainment), has pre-sold the first of three exclusive Emmersive NFTs (E-NFTs) released as a package investment to a private third-party investor.
- The deal structure includes an initial payment of Two Million Dollars ($2,000,000) for the three-celebrity set.
- The unique digital assets are expected to generate additional monies through revenue sharing based upon their individual sale prices determined in an upcoming digital art auction at one of the world’s preeminent auction houses.
“We are thrilled to have executed our first pre-sales in the space,” said Emmersive Co-Founder, David J. Kovacs. “We will re-define digital art and entertainment through our Augmented Reality Experience and look to continue to push the limits on technology. We are confident this is only the beginning as our company becomes an industry leader within the NFT universe,” added Kovacs.
Trader Notes
Share Information
| SHARE FLOAT (%) | 19.35 M (70.52%) |
| % HELD BY INSTITUTIONS | 6.89 |
| DIVIDENDS PER SHARE | 0.00 |
Recent Stock Performance
| 5-DAY PERF. | +8.68% |
| 1-MONTH PERF. | +25.24% |
| 3-MONTH PERF. | -34.09% |
| 6-MONTH PERF. | +76.51% |
| YTD PERF. | +91.97% |
| 1-YEAR PERF. | +7.79% |
Moving Averages
| +/- EMA(20) | 2.45 (+7.35%) |
| +/- SMA(50) | 2.62 (+0.38%) |
| +/- SMA(200) | 2.32 (+13.36%) |
Pivot Points
| Name | S3 | S2 | S1 | Pivot Points | R1 | R2 | R3 |
| Classic | 2.0767 | 2.3033 | 2.4667 | 2.6933 | 2.8567 | 3.0833 | 3.2467 |
| Fibonacci | 2.3033 | 2.4523 | 2.5444 | 2.6933 | 2.8423 | 2.9344 | 3.0833 |
Technical Indicators
| Symbol | Value | Result | Symbol | Value | Result |
| ADX | 16.5640 | Neutral | ATR14 | 0.2509 | |
| CCI20 | 132.0381 | Buy | Chaikin Money Flow | -0.0874 | Sell |
| MACD | -0.0469 | Sell | Money Flow Index | 69.0109 | Neutral |
| ROC | 1.9380 | Buy | RSI | 56.2802 | Buy |
| STOCH (14,3) | 63.2911 | Buy | STOCH RSI | 0.9400 | OverBought |
| UO | 45.9422 | Buy | Williams %R | -36.7089 | Neutral |
