Adamis Pharmaceuticals Corp (NASDAQ:ADMP) stock closed slightly higher on Tuesday. What’s coming next?
Market Action
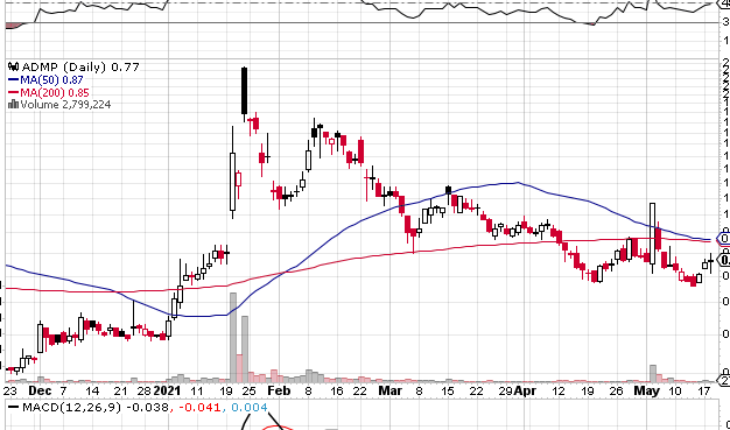
On Tuesday, ADMP surged 1.36% or $0.0103 to end the session at $0.7697. Total volume for the session stood at 2.68 million shares, above its average volume of 5.56 million. The stock opened at $0.7616 and moved within a wide range of $0.7140 – 0.7988.
ADMP Issued News Yesterday
Yesterday morning the company release news. Here are the key highlights:
Adamis Pharmaceuticals Resubmits ZIMHI New Drug Application to FDA for the Treatment of Opioid Overdose
- ADMP announced that the New Drug Application (NDA) was resubmitted to the U.S. Food and Drug Administration (FDA) for ZIMHI™, a naloxone injection product candidate intended for the treatment of opioid overdose.
- “Based on FDA feedback received during our Type A meeting in April, we have resubmitted our NDA for ZIMHI, which I am confident fully addresses the issues raised in the November 13, 2020 Complete Response Letter,” said Dr. Dennis J. Carlo, President and Chief Executive Officer of Adamis Pharmaceuticals.
“We are committed to working collaboratively with the agency as it conducts its review of the resubmitted NDA. I continue to believe the availability of additional naloxone products, especially our higher dose intramuscular injection product, which has definite advantages over the two approved intranasal products, could potentially save thousands of lives.”
Trader Notes
Share Information
| SHARES OUTSTANDING | 148.89 M |
| SHARE FLOAT (%) | 147.32 M (98.95%) |
| % HELD BY INSTITUTIONS | 10.67 |
Recent Stock Performance
| 5-DAY PERF. | +7.65% |
| 1-MONTH PERF. | +5.58% |
| 3-MONTH PERF. | -42.99% |
| 6-MONTH PERF. | +91.13% |
| YTD PERF. | +58.67% |
| 1-YEAR PERF. | +35.04% |
Moving Averages
| +/- EMA(20) | 0.77 (+0.00%) |
| +/- SMA(50) | 0.87 (-11.49%) |
| +/- SMA(200) | 0.85 (-9.41%) |
Pivot Points
| Name | S3 | S2 | S1 | Pivot Points | R1 | R2 | R3 |
| Classic | 0.6381 | 0.6760 | 0.7229 | 0.7608 | 0.8077 | 0.8456 | 0.8925 |
| Fibonacci | 0.6760 | 0.7084 | 0.7284 | 0.7608 | 0.7932 | 0.8132 | 0.8456 |
Technical Indicators
| Symbol | Value | Result | Symbol | Value | Result |
| ADX | 23.3131 | Neutral | ATR14 | 0.0947 | |
| CCI20 | -11.9024 | Neutral | Chaikin Money Flow | 0.0687 | Buy |
| MACD | -0.0555 | Sell | Money Flow Index | 59.2360 | Sell |
| ROC | -2.3347 | Sell | RSI | 48.5145 | Buy |
| STOCH (14,3) | 26.7561 | Buy | STOCH RSI | 1.0000 | OverBought |
| UO | 47.8239 | Buy | Williams %R | -73.2439 | Neutral |


