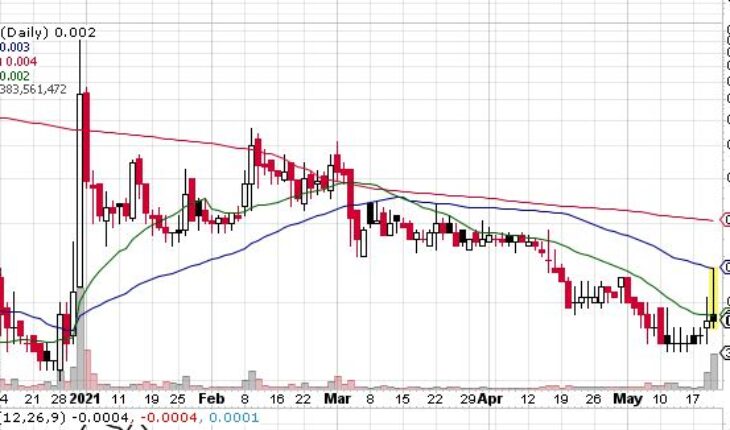
Raadr Inc (OTCMKTS:RDAR) is trading sideways on Thursday.
Market Action
As of 1:32, RDAR stock is unchanged at $0.0017. Total volume was 379.14 million shares have traded hands, compared to its average volume of 29.38 million shares. The stock has moved in a range of 0.0016 – 0.0027 after opening at $0.0018.
RDAR Company Description
Raadr, Inc. offers a software tool that allows individuals to monitor social media activity online. It provides RAADR, a software development and mobile application for social media monitoring, facial recognition, and to view private messages and browser history, as well as to get real time alerts. The company was formerly known as PITOOEY!, Inc. and changed its name to Raadr, Inc. in July 2015. Raadr, Inc. was founded in 2006 and is headquartered in Phoenix, Arizona.
Trader Notes
Share Information
| SHARES OUTSTANDING | 1.06 M |
| SHARE FLOAT (%) | 1.00 M (94.78%) |
| % HELD BY INSTITUTIONS | – |
Recent Stock Performance
| 5-DAY PERF. | +21.43% |
| 1-MONTH PERF. | -10.53% |
| 3-MONTH PERF. | -66.00% |
| 6-MONTH PERF. | +21.43% |
| YTD PERF. | -86.51% |
| 1-YEAR PERF. | -89.70% |
Moving Averages
| +/- EMA(20) | 0.0018 (-5.56%) |
| +/- SMA(50) | 0.0027 (-37.04%) |
| +/- SMA(200) | 0.0041 (-58.54%) |
Pivot Points
| Name | S3 | S2 | S1 | Pivot Points | R1 | R2 | R3 |
| Classic | 0.0007 | 0.0010 | 0.0014 | 0.0017 | 0.0021 | 0.0024 | 0.0028 |
| Fibonacci | 0.0010 | 0.0013 | 0.0015 | 0.0017 | 0.0020 | 0.0022 | 0.0024 |
Technical Indicators
| Symbol | Value | Result | Symbol | Value | Result |
| ADX | 48.5298 | Buy | ATR14 | 0.0005 | |
| CCI20 | -21.5054 | Neutral | Chaikin Money Flow | -0.2791 | Sell |
| MACD | -0.0005 | Sell | Money Flow Index | 39.6969 | Buy |
| ROC | -15.0000 | Sell | RSI | 41.2047 | Buy |
| STOCH (14,3) | 33.3333 | Buy | STOCH RSI | 1.0000 | OverBought |
| UO | 31.6022 | Sell | Williams %R | -66.6667 | Neutral |


