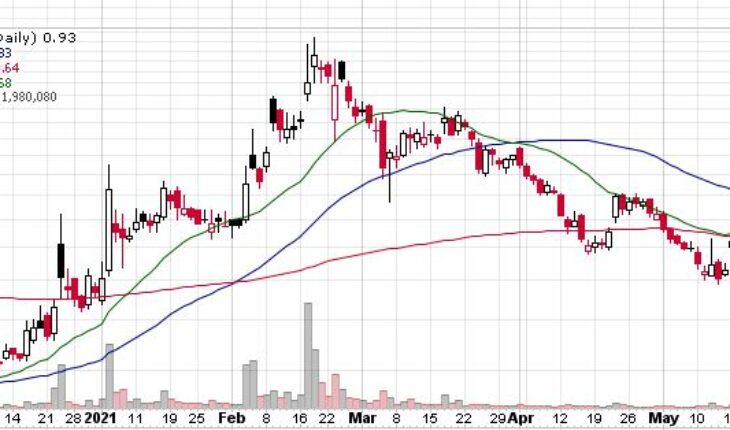
After a big earlier this week, Onconova Therapeutics Inc (NASDAQ:ONTX) is falling in the pre-market session on Thursday.
Market Action
As of 8:43, ONTX stock is trading at $0.84, down by 0.09 or 9.46% in the pre-market session with more than 2.10 million shares have traded hands.
ONTX Announces News
Onconova Therapeutics Announces Reverse Stock Split and Decrease in Authorized Shares
- ONTX today announced a one-for-fifteen reverse stock split of its common stock, effective May 20, 2021. Beginning at the open of trading on May 21, 2021, Onconova’s common stock will trade on the Nasdaq Capital Market on a split-adjusted basis.
- At Onconova’s 2021 reconvened annual meeting of stockholders on April 30, 2021, Onconova stockholders authorized the Company’s Board of Directors to amend the Tenth Amended and Restated Certificate of Incorporation, as amended (the “Certificate of Incorporation”), to effect a reverse stock split at a ratio in the range of one-for-five to one-for-fifteen.
- Onconova’s Board of Directors subsequently approved a reverse stock split ratio of one-for-fifteen, and the Company filed with the Secretary of State of the State of Delaware a Certificate of Amendment (the “Certificate of Amendment”) to its Certificate of Incorporation to effect the reverse stock split, which became effective upon the filing of the Certificate of Amendment with the Secretary of State of the State of Delaware on May 20, 2021.
Trader Notes
Share Information
| SHARES OUTSTANDING | 236.61 M |
| SHARE FLOAT (%) | 221.71 M (93.70%) |
| % HELD BY INSTITUTIONS | 14.16 |
Recent Stock Performance
| 5-DAY PERF. | +70.04% |
| 1-MONTH PERF. | +51.22% |
| 3-MONTH PERF. | -43.43% |
| 6-MONTH PERF. | +246.18% |
| YTD PERF. | +98.58% |
| 1-YEAR PERF. | +156.09% |
Moving Averages
| +/- EMA(20) | 0.70 (+32.86%) |
| +/- SMA(50) | 0.83 (+12.05%) |
| +/- SMA(200) | 0.63 (+47.62%) |
Pivot Points
| Name | S3 | S2 | S1 | Pivot Points | R1 | R2 | R3 |
| Classic | 0.5975 | 0.7050 | 0.8150 | 0.9225 | 1.0325 | 1.1400 | 1.2500 |
| Fibonacci | 0.7050 | 0.7881 | 0.8394 | 0.9225 | 1.0056 | 1.0569 | 1.1400 |
Technical Indicators
| Symbol | Value | Result | Symbol | Value | Result |
| ADX | 33.3194 | Sell | ATR14 | 0.1287 | |
| CCI20 | 152.5838 | Buy | Chaikin Money Flow | 0.3839 | Buy |
| MACD | -0.0221 | Sell | Money Flow Index | 65.3579 | Buy |
| ROC | 39.5173 | Buy | RSI | 60.9913 | Buy |
| STOCH (14,3) | 71.4519 | Buy | STOCH RSI | 0.7205 | Buy |
| UO | 60.4154 | Buy | Williams %R | -28.5481 | Neutral |


