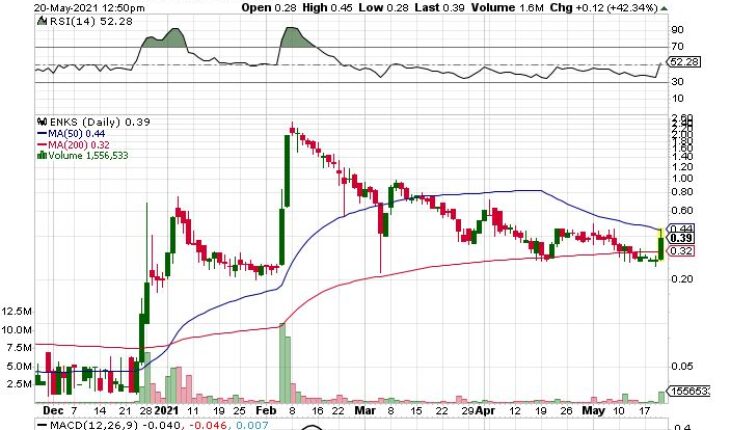
Enerkon Solar International Inc (OTCMKTS:ENKS) has been moving in a narrow range after gaining more than 65% in Thursday’s morning session.
Market Action
As of 12:50 ENKS is trading at $0.39, up $0.11 gaining 42.34% so far on the day. Volume is 1.5 million shares 82% higher than its 50-day Avg. Volume. The stock opened at $0.27 and has traded in a range between $0.27 and $0.45.
ENKS Releases news
Enerkon Solar International To Begin BuyBack Program
- The company announces that it has started a buyback campaign and will initiate it with a purchase of 25 million shares from the company chairman.
- These share as under rule 144 have been held for 3 years and so are now eligible for sale as free trading. Since the chairman didn’t want to sell its shares in to the open public he gave the company the option to buy majority of its shares.
“It will benefit the public shareholders in general, as the effects of the action will be the contraction in outstanding common stock, which will raise the Per Share ‘book value’ accordingly, without having to resort to a reverse split which is not popular with companies or shareholders.”
“These actions are taken as a prelude to Up List Plans to the NASDAQ market which maintains a minimum share entry price of $4.00 to qualify for listing on the national exchange.” As stated by the CEO MR. Benjamin.
Trader Notes
Share Information
|
SHARES OUTSTANDING |
65.61 M |
|
SHARE FLOAT (%) |
32.65 M (49.76%) |
|
% HELD BY INSTITUTIONS |
– |
Recent Stock Performance
|
5-DAY PERF. |
+35.89% |
|
1-MONTH PERF. |
+39.29% |
|
3-MONTH PERF. |
-69.53% |
|
6-MONTH PERF. |
+578.26% |
|
YTD PERF. |
+95.00% |
|
1-YEAR PERF. |
+664.71% |
Moving Averages
|
+/- EMA(20) |
0.35 (+11.43%) |
|
+/- SMA(50) |
0.44 (-11.36%) |
|
+/- SMA(200) |
0.32 (+21.88%) |
Pivot Points
|
Name |
S3 |
S2 |
S1 |
Pivot Points |
R1 |
R2 |
R3 |
|
Classic |
0.2079 |
0.2295 |
0.2517 |
0.2733 |
0.2955 |
0.3171 |
0.3393 |
|
Fibonacci |
0.2295 |
0.2462 |
0.2565 |
0.2733 |
0.2900 |
0.3003 |
0.3171 |
Technical Indicators
|
Symbol |
Value |
Result |
Symbol |
Value |
Result |
|
ADX |
29.5316 |
Sell |
ATR14 |
0.0873 |
|
|
CCI20 |
-115.6522 |
Sell |
Chaikin Money Flow |
0.0488 |
Neutral |
|
MACD |
-0.0800 |
Sell |
Money Flow Index |
35.3846 |
Sell |
|
ROC |
-32.5123 |
Sell |
RSI |
42.3114 |
Sell |
|
STOCH (14,3) |
9.4650 |
OverSold |
STOCH RSI |
0.0000 |
OverSold |
|
UO |
48.0696 |
Buy |
Williams %R |
-90.5350 |
OverSold |


