Aftermath Silver Ltd. (OTCMKTS:AAGFF) gained momentum at the start of the day but couldn’t hold on to it, so is it a buy,sell or hold?
Market Action
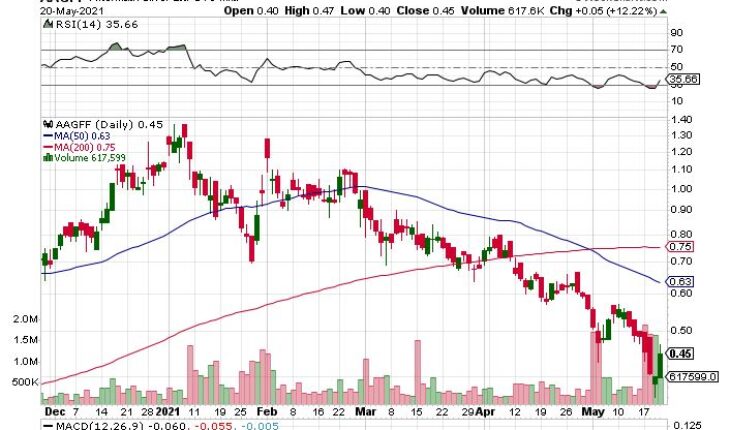
On Thursday, AAGFF stock closed at $0.447 gained 12.23% to $0.0487. The stock has a total volume of almost 617K shares, 20% above compared to its average volume of 494K. The stock has moved in a range of $0.3980 – $0.4665 after opening at $0.398.
AAGFF Business Description
Aftermath Silver Ltd. is an exploration company based in Canada. The company acquires, explores, and develops mineral properties. The company has two-segment, one being acquisition and the other being the development of mineral properties.
AAGFF Latest Developments
Aftermath Silver Provides an update on the Challacollo.
- The company provides an update on the Challacollo Drill and purchase agreement. Approximately 84% of the indicated and inferred mineral resources are now constrained by an optimized open pit shell, allowing the company to instigate lower grade material and second-order grade veins into the pit shell.
- The company has split the 4th and 5th payment for Challacollo into two parts. It also decided to make the first payment of C$3 million; 50% cash and 50% in Aftermath Silver common shares.
Ralph Rushton, President and CEO of the Company commented, “The opportunity to potentially develop a parallel lower grade heap leach project from the breccia mineralisation is an important increment to the project, this material would otherwise be mined as waste in an open pit. The potential to develop the second order higher grade veins will be investigated with the infill component of the drill programs that will be announced shortly.”
Trader Notes
Share Information
| SHARES OUTSTANDING | 133.10 M |
| SHARE FLOAT (%) | 108.39 M (81.43%) |
| % HELD BY INSTITUTIONS | 4.71 |
Recent Stock Performance
| 5-DAY PERF. | -8.71% |
| 1-MONTH PERF. | -22.77% |
| 3-MONTH PERF. | -52.44% |
| 6-MONTH PERF. | -35.17% |
| YTD PERF. | -59.88% |
| 1-YEAR PERF. | +103.87% |
Moving Averages
| +/- EMA(20) | 0.51 (-11.76%) |
| +/- SMA(50) | 0.63 (-28.57%) |
| +/- SMA(200) | 0.75 (-40.00%) |
Pivot Points
| Name | S3 | S2 | S1 | Pivot Points | R1 | R2 | R3 |
| Classic | 0.3394 | 0.3687 | 0.4080 | 0.4373 | 0.4766 | 0.5059 | 0.5452 |
| Fibonacci | 0.3687 | 0.3949 | 0.4111 | 0.4373 | 0.4635 | 0.4797 | 0.5059 |
Technical Indicators
| Symbol | Value | Result | Symbol | Value | Result |
| ADX | 16.6474 | Neutral | ATR14 | 0.0588 | |
| CCI20 | -105.1131 | Sell | Chaikin Money Flow | -0.1964 | Sell |
| MACD | -0.0745 | Sell | Money Flow Index | 21.2060 | Sell |
| ROC | -5.2932 | Sell | RSI | 35.7815 | Buy |
| STOCH (14,3) | 41.5714 | Neutral | STOCH RSI | 0.9434 | OverBought |
| UO | 39.1176 | Sell | Williams %R | -58.4286 | Neutral |


