Mondial Ventures (OTCMKTS:MNVN) stock ended with a mild gain on Thursday after the news.
Market Action
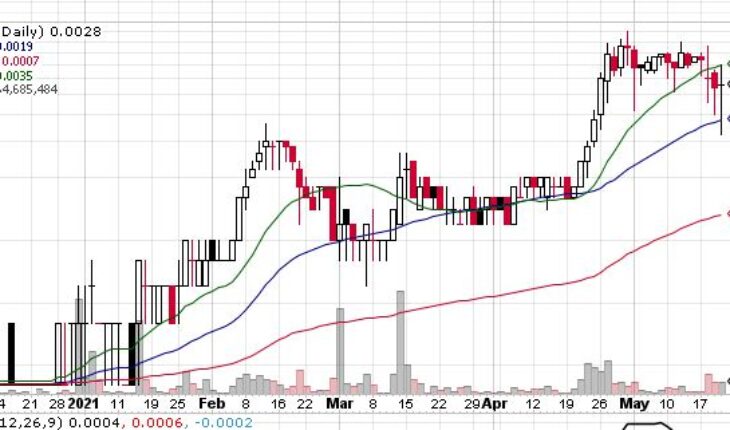
MNVN stock ended Thursday at $0.0028, up by 3.70%. More than 64.68 million shares traded hands, above its 30-day average of 57.83 million shares. The stock opened at $0.0028 and moved within a range of $0.0016 – 0.0035.
MNVN Released News
Mondial Ventures, Inc. Announces Update On Its Corporate Status and Intent to Become Current in Its OTC Listing
- MNVN announced its current plans to update its corporate filings on the OTCIQ system, become OTC compliant, and retain a Pink Sheet current listing in order to create a successful path towards revamping its corporate directive.
- Mondial Ventures Inc. has historically been an oil and gas production company focused on the recovery and development of oil and natural gas. Recently, several opportunities have presented themselves prompting management to proactively bring the Company out of its dormant status in order to exploit these various opportunities.
- Additionally, the Company has recently filed a Form 506(B) Regulation D with the Securities Exchange Commission to raise up to $1,000,000 dollars with $100,000 already received in subscription agreement(s) utilizing authorized restricted shares at the current market price. Proceeds shall be used to bring the Company current, revamp its infrastructure, corporate website, social media presence, and provide general working capital to administrative operations.
Trader Notes
Share Information
| SHARES OUTSTANDING | 1,976.03 M |
| SHARE FLOAT (%) | 1,791.03 M – |
| % HELD BY INSTITUTIONS | – |
Recent Stock Performance
| 5-DAY PERF. | -20.00% |
| 1-MONTH PERF. | +211.11% |
| 3-MONTH PERF. | +211.11% |
| 6-MONTH PERF. | +2700.00% |
| YTD PERF. | +1300.00% |
| 1-YEAR PERF. | +2700.00% |
Moving Averages
| +/- EMA(20) | 0.0031 (-9.68%) |
| +/- SMA(50) | 0.0019 (+47.37%) |
| +/- SMA(200) | 0.0007 (+300.00%) |
Pivot Points
| Name | S3 | S2 | S1 | Pivot Points | R1 | R2 | R3 |
| Classic | -0.0001 | 0.0007 | 0.0018 | 0.0026 | 0.0037 | 0.0045 | 0.0056 |
| Fibonacci | 0.0007 | 0.0015 | 0.0019 | 0.0026 | 0.0034 | 0.0038 | 0.0045 |
Technical Indicators
| Symbol | Value | Result | Symbol | Value | Result |
| ADX | 33.9215 | Sell | ATR14 | 0.0010 | |
| CCI20 | -112.8205 | Sell | Chaikin Money Flow | 0.2980 | Buy |
| MACD | 0.0004 | Buy | Money Flow Index | 22.8689 | Sell |
| ROC | -17.6471 | Sell | RSI | 48.8152 | Sell |
| STOCH (14,3) | 41.3793 | Sell | STOCH RSI | 0.0653 | OverSold |
| UO | 55.4634 | Sell | Williams %R | -58.6207 | Neutral |


