Jaguar Health Inc (NASDAQ:JAGX) is trading slightly lower in the opening session on Friday.
Market Action
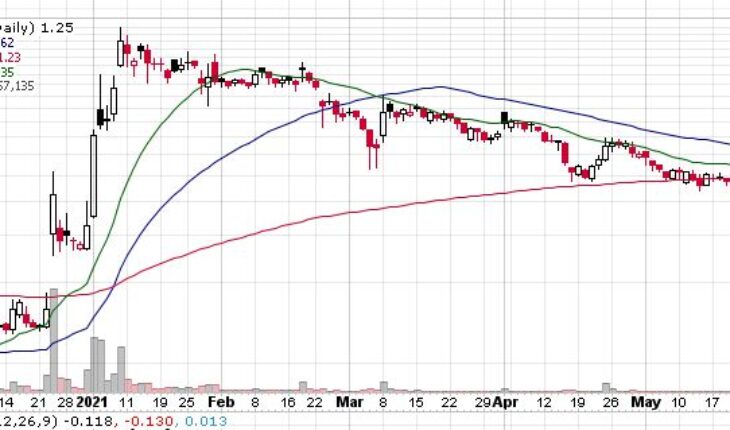
As of 9:55, JAGX is down by 0.80% to $1.24. Total volume for the session stood at 161K shares, below its average volume of 8.90 million. The stock opened at $1.24 and moved within a narrow range of $1.2200 – 1.2500.
JAGX Issued News
Jaguar Health and Napo Pharmaceuticals Provide Key Findings from Cancer-related Diarrhea Abstracts Submitted to ASCO for June 2021 Annual Meeting
- announced the highlights of the abstract regarding patient outcomes associated with cancer-related diarrhea (“CRD”) by Napo Pharmaceuticals, Inc. (“Napo”), Jaguar’s wholly owned subsidiary, and Napo’s collaborators that has been accepted for poster presentation at the American Society of Clinical Oncology (ASCO®) Annual Meeting, which will be held virtually from June 4-8, 2021.
- In addition, two CRD-related abstracts from Napo and its collaborators have been accepted for online publication at ASCO.
- Abstract accepted for poster presentation: The impact of cancer-related diarrhea on changes in cancer therapy patterns: Real world evidence
- ASCO received more than 5,400 abstracts for the 2021 ASCO Annual Meeting, which were reviewed by the Society’s Scientific Program Committee and ASCO Leadership. Additional information about the 2021 ASCO Annual Meeting can be found on the ASCO website: https://meetings.asco.org/am/attend.
- As previously announced, Napo’s pivotal Phase 3 clinical trial of crofelemer (Mytesi®) for prophylaxis of diarrhea in adult cancer patients receiving targeted therapy was initiated in October 2020 and is ongoing.
Trader Notes
Share Information
| SHARES OUTSTANDING | 139.44 M |
| SHARE FLOAT (%) | 121.05 M (86.81%) |
| % HELD BY INSTITUTIONS | 7.79 |
Recent Stock Performance
| 5-DAY PERF. | -2.76% |
| 1-MONTH PERF. | -9.19% |
| 3-MONTH PERF. | -56.82% |
| 6-MONTH PERF. | +499.22% |
| YTD PERF. | +51.53% |
| 1-YEAR PERF. | +92.97% |
Moving Averages
| +/- EMA(20) | 1.34 (-7.46%) |
| +/- SMA(50) | 1.63 (-23.93%) |
| +/- SMA(200) | 1.23 (+0.81%) |
Pivot Points
| Name | S3 | S2 | S1 | Pivot Points | R1 | R2 | R3 |
| Classic | 1.1000 | 1.1300 | 1.1900 | 1.2200 | 1.2800 | 1.3100 | 1.3700 |
| Fibonacci | 1.1300 | 1.1644 | 1.1856 | 1.2200 | 1.2544 | 1.2756 | 1.3100 |
Technical Indicators
| Symbol | Value | Result | Symbol | Value | Result |
| ADX | 18.4334 | Neutral | ATR14 | 0.1556 | |
| CCI20 | -66.7808 | Sell | Chaikin Money Flow | 0.1207 | Buy |
| MACD | -0.1575 | Sell | Money Flow Index | 23.2996 | Sell |
| ROC | -8.7591 | Sell | RSI | 41.7716 | Buy |
| STOCH (14,3) | 34.0309 | Buy | STOCH RSI | 1.0000 | OverBought |
| UO | 54.2859 | Buy | Williams %R | -65.9691 | Neutral |
