KULR Technology Group (OTCMKTS:KULR) stock ended slightly on Thursday.
Market Action
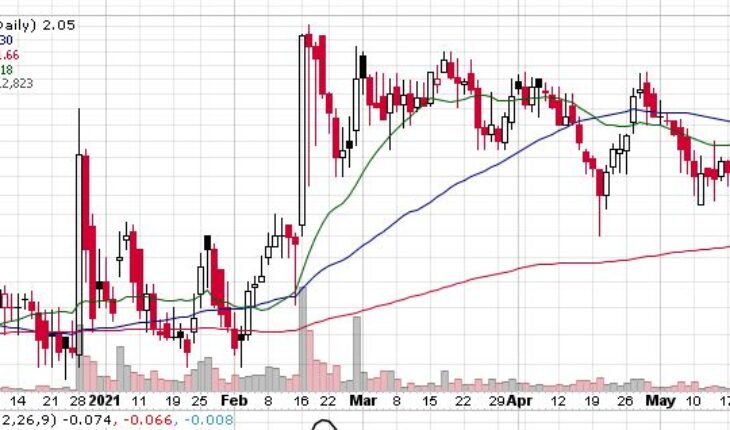
KULR stock ended Thursday at $2.05, went up by 0.99%. More than 112K shares traded hands, below its 30-day average of 185K million shares. The stock opened at $2.03 and moved within a wide range of $2.0300 – 2.2700.
KULR Released News
KULR Technology Group Announces Pricing of $6.5 Million Offering
- announced that it has entered into a securities purchase agreement (the “Purchase Agreement”) with Yorkville Advisors for the purchase and sale of an aggregate of 650 shares of Preferred Stock (the “Preferred Stock”), with each share of Preferred Stock having a stated value of $10,000 per share and being convertible into shares of the Company’s common stock (the “Common Stock”) at a fixed price of $2.05 per share, and Warrants (the “Warrants”) to purchase up to an aggregate of 2,600,000 shares of Common Stock at a purchase price of $2.50 per share.
- The Warrants have an exercise price of $2.50 per share, are exercisable immediately, and will expire one (1) year following the date of issuance. The Purchase Agreement includes a provision for a lock-up period expiring the earlier of June 4th, 2021, or the Company’s listing on a senior U.S. exchange. The Company will pay Yorkville Advisors a commitment fee equal to 1,300,000 shares of the Company’s Common Stock at the closing of the offering. The closing of the offering is expected to occur on or about May 20, 2021, subject to the satisfaction of customary closing conditions.
Trader Notes
Share Information
| SHARES OUTSTANDING | 92.63 M |
| SHARE FLOAT (%) | 55.05 M (59.43%) |
| % HELD BY INSTITUTIONS | – |
Recent Stock Performance
| 5-DAY PERF. | +3.54% |
| 1-MONTH PERF. | +7.89% |
| 3-MONTH PERF. | -18.00% |
| 6-MONTH PERF. | +66.67% |
| YTD PERF. | +39.46% |
| 1-YEAR PERF. | +105.00% |
Moving Averages
| +/- EMA(20) | 2.13 (-3.76%) |
| +/- SMA(50) | 2.30 (-10.87%) |
| +/- SMA(200) | 1.66 (+23.49%) |
Pivot Points
| Name | S3 | S2 | S1 | Pivot Points | R1 | R2 | R3 |
| Classic | 1.7233 | 1.8767 | 1.9633 | 2.1167 | 2.2033 | 2.3567 | 2.4433 |
| Fibonacci | 1.8767 | 1.9683 | 2.0250 | 2.1167 | 2.2083 | 2.2650 | 2.3567 |
Technical Indicators
| Symbol | Value | Result | Symbol | Value | Result |
| ADX | 27.8990 | Buy | ATR14 | 0.2227 | |
| CCI20 | -26.2585 | Neutral | Chaikin Money Flow | -0.0430 | Neutral |
| MACD | -0.0493 | Sell | Money Flow Index | 31.1721 | Sell |
| ROC | -11.6189 | Sell | RSI | 45.6345 | Buy |
| STOCH (14,3) | 33.3333 | Buy | STOCH RSI | 0.8549 | OverBought |
| UO | 49.8950 | Buy | Williams %R | -66.6667 | Neutral |


