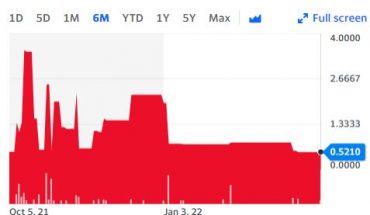
Hop- On Inc. (OTCMKTS:HPNN) gained yesterday, but will the stock keep on going?
Market Action
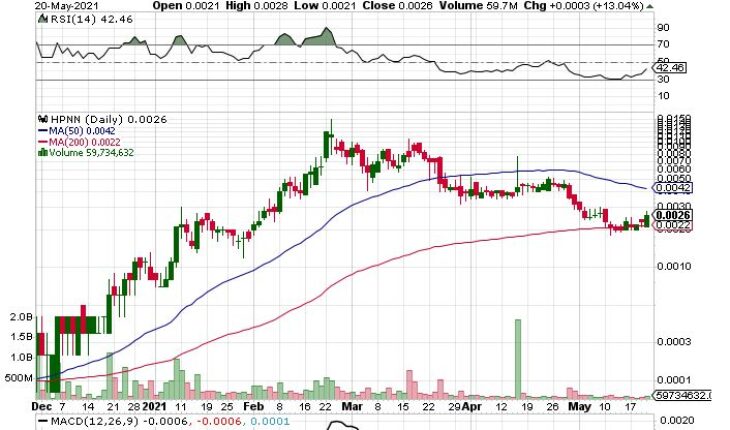
On Thursday, HPNN stock closed at $0.0026 gained 13.04% or $0.0003. The stock has a total volume of almost 59.73 million shares compared to its average volume of 146.33 million. The stock has moved in a range of $0.0021 – $0.0028 after opening at $0.0021.
HPNN Business Description
Hop- On Inc. (OTCMKTS:HPNN) is a U.S. – based company. It is a manufacturer and developer of electronics, telecom hardware, computing services, and distributed software.
HPNN Latest Developments
Hop- On Inc. launches an alpha version of their proprietor social media platform that will promote digital rights management of influencers by utilizing a decentralized platform at www.digitalage.com
- The aim is to promote the free sharing of dialogues, ideas, and debates. The company will not censor any opinion of any user, no matter how much the company may disagree with the user.
- The company is looking to compete against the monopolistic nature of Facebook, WeChat, Youtube, Instagram, and whatsapp globally.
- The company believes that every individual has the right to express himself, and even the supreme court of the United States has upheld the right to freedom of speech. Hence, the company is against the act of censoring or removing the content of users.
Peter Michaels, CEO of Hop-on, stated, “My Philosophy of Free Speech is promoting open and free sharing of ideas and content, dialogue, and debate, within the confines of U.S. law.
If ideas are not shared and discussed and “big tech”, “big brother” and others silence them, I believe it will create hate and could lead to violence.”
Trader Notes
Share Information
| SHARES OUTSTANDING | 7,448.05 M |
| SHARE FLOAT (%) | – |
| % HELD BY INSTITUTIONS | – |
Recent Stock Performance
| 5-DAY PERF. | +30.00% |
| 1-MONTH PERF. | -39.53% |
| 3-MONTH PERF. | -58.73% |
| 6-MONTH PERF. | +2500.00% |
| YTD PERF. | +225.00% |
| 1-YEAR PERF. | +2500.00% |
Moving Averages
| +/- EMA(20) | 0.0028 (-7.14%) |
| +/- SMA(50) | 0.0042 (-38.10%) |
| +/- SMA(200) | 0.0022 (+18.18%) |
Pivot Points
| Name | S3 | S2 | S1 | Pivot Points | R1 | R2 | R3 |
| Classic | 0.0015 | 0.0018 | 0.0022 | 0.0025 | 0.0029 | 0.0032 | 0.0036 |
| Fibonacci | 0.0018 | 0.0021 | 0.0022 | 0.0025 | 0.0028 | 0.0029 | 0.0032 |
Technical Indicators
| Symbol | Value | Result | Symbol | Value | Result |
| ADX | 53.3238 | Buy | ATR14 | 0.0008 | |
| CCI20 | -39.1826 | Neutral | Chaikin Money Flow | -0.3194 | Sell |
| MACD | -0.0007 | Sell | Money Flow Index | 32.3816 | Buy |
| ROC | 4.0000 | Buy | RSI | 48.4287 | Buy |
| STOCH (14,3) | 50.0000 | Buy | STOCH RSI | 1.0000 | OverBought |
| UO | 49.8246 | Buy | Williams %R | -50.0000 | Neutral |
