Resonant Inc (NASDAQ:RESN) ended sharply higher on Friday.
Market Action
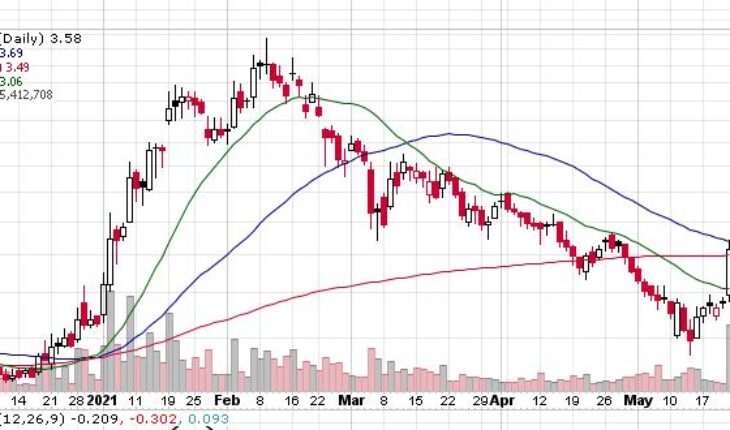
On Friday, RESN stock surged 23.45% to end the session at $3.58. More than 5.42 million shares exchanged hands for the day, well above its average volume of 1.35 million shares. The stock opened at $2.97 and moved within a range of $2.9000 – 3.7000.
Resonant Business Description
- Resonant (NASDAQ: RESN) is transforming the market for RF front-ends (RFFE) by disrupting the RFFE supply chain through the delivery of solutions that leverage our Infinite Synthesized Network (ISN) design software tools platform, capitalize on the breadth of our IP portfolio, and are delivered through our services offerings. In a market that is critically constrained by limited designers, tools and capacity, Resonant addresses these critical problems by providing customers with ever increasing design efficiency, reduced time to market and lower unit costs.
- Customers leverage Resonant’s disruptive capabilities to design cutting edge filters and modules, while capitalizing on the added stability of a diverse supply chain through Resonant’s fabless ecosystem-the first of its kind. Working with Resonant, customers enhance the connectivity of current mobile devices, while preparing for the demands of emerging 5G applications.
Trader Notes
Share Information
| SHARE FLOAT (%) | 56.17 M (93.17%) |
| % HELD BY INSTITUTIONS | 32.62 |
| DIVIDENDS PER SHARE | 0.00 |
Recent Stock Performance
| 5-DAY PERF. | +31.62% |
| 1-MONTH PERF. | +2.87% |
| 3-MONTH PERF. | -46.41% |
| 6-MONTH PERF. | +56.33% |
| YTD PERF. | +35.09% |
| 1-YEAR PERF. | +62.73% |
Moving Averages
| +/- EMA(20) | 3.10 (+15.48%) |
| +/- SMA(50) | 3.69 (-2.98%) |
| +/- SMA(200) | 3.49 (+2.58%) |
Pivot Points
| Name | S3 | S2 | S1 | Pivot Points | R1 | R2 | R3 |
| Classic | 2.2867 | 2.5933 | 3.0867 | 3.3933 | 3.8867 | 4.1933 | 4.6867 |
| Fibonacci | 2.5933 | 2.8989 | 3.0877 | 3.3933 | 3.6989 | 3.8877 | 4.1933 |
Technical Indicators
| Symbol | Value | Result | Symbol | Value | Result |
| ADX | 22.0208 | Neutral | ATR14 | 0.3371 | |
| CCI20 | 75.9612 | Buy | Chaikin Money Flow | 0.0204 | Neutral |
| MACD | -0.2956 | Sell | Money Flow Index | 51.3180 | Buy |
| ROC | 20.1342 | Buy | RSI | 57.3957 | Buy |
| STOCH (14,3) | 91.1111 | OverBought | STOCH RSI | 1.0000 | OverBought |
| UO | 62.0124 | Buy | Williams %R | -8.8889 | OverBought |


