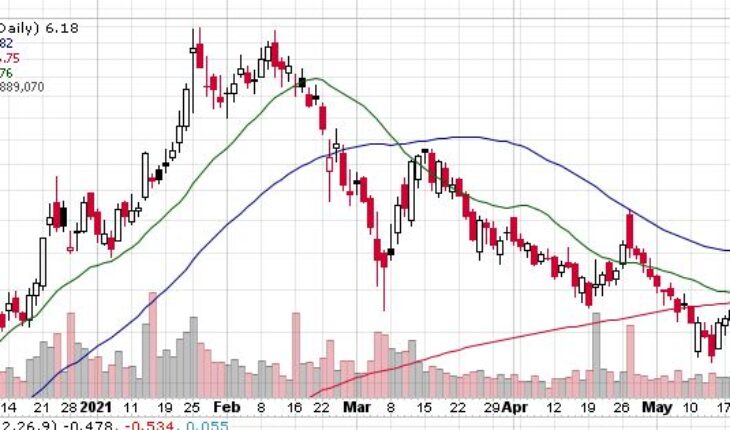
Nano Dimension Ltd (NASDAQ:NNDM) stock continued to move lower last week.
Market Action
NNDM stock was down 3.59% to $6.18 on Friday. More than 8.89 shares traded hands. The stock opened at the lowest point of the session at $6.38 and moved within a range of $6.18 – 6.47.
NNDM Released News Last Week
20 May, 2021 – Nano Dimension Reports 2021 First Quarter Financial Results with CEO Letter to Shareholders
- Nano Dimension reported revenues of $811,000 for the first quarter of 2021. The Company ended the quarter with a cash and deposits balance of $1,471,014,000 (including short and long-term unrestricted bank deposits), while net loss for the first quarter was $9,314,000.
- Net loss for the first quarter of 2021 was $9,314,000, or $0.05 per share, compared to $17,439,000, or $0.20 per share, in the fourth quarter of 2020, and $2,074,000, or $0.32 per share, in the first quarter of 2020.
- Cash and cash equivalents, together with short and long-term bank deposits totaled $1,471,014,000 as of March 31, 2021, compared to $670,934,000 as of December 31, 2020. The increase compared to December 31, 2020, mainly reflects proceeds received from the sale of American Depositary Shares representing the Company’s ordinary shares.
Trader Notes
Share Information
| SHARES OUTSTANDING | 172.05 M |
| SHARE FLOAT (%) | 171.93 M (99.93%) |
| % HELD BY INSTITUTIONS | 25.39 |
Recent Stock Performance
| 5-DAY PERF. | -0.80% |
| 1-MONTH PERF. | -16.37% |
| 3-MONTH PERF. | -55.44% |
| 6-MONTH PERF. | +39.50% |
| YTD PERF. | -32.09% |
| 1-YEAR PERF. | +100.00% |
Moving Averages
| +/- EMA(20) | 6.65 (-7.07%) |
| +/- SMA(50) | 7.82 (-20.97%) |
| +/- SMA(200) | 6.75 (-8.44%) |
Pivot Points
| Name | S3 | S2 | S1 | Pivot Points | R1 | R2 | R3 |
| Classic | 5.7767 | 5.9733 | 6.0767 | 6.2733 | 6.3767 | 6.5733 | 6.6767 |
| Fibonacci | 5.9733 | 6.0879 | 6.1587 | 6.2733 | 6.3879 | 6.4587 | 6.5733 |
Technical Indicators
| Symbol | Value | Result | Symbol | Value | Result |
| ADX | 27.0879 | Sell | ATR14 | 0.6669 | |
| CCI20 | -51.5754 | Sell | Chaikin Money Flow | -0.1220 | Sell |
| MACD | -0.6602 | Sell | Money Flow Index | 40.6031 | Sell |
| ROC | -10.0437 | Sell | RSI | 41.2466 | Buy |
| STOCH (14,3) | 44.1341 | Buy | STOCH RSI | 0.8214 | OverBought |
| UO | 51.8312 | Buy | Williams %R | -55.8659 | Neutral |
