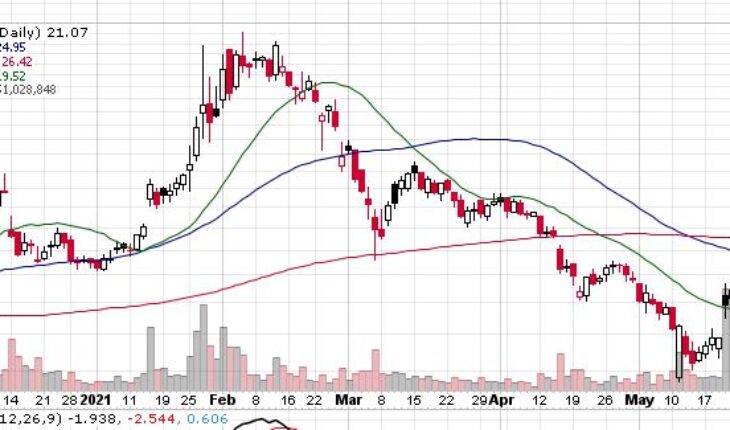
Virgin Galactic Holdings (NASDAQ: SPCE) was one of the major gainers last week as the stock soared almost 35% for the week.
Market Action
On Friday, SPCE stock moved up 6.36% to end the session at $21.07. More than 50.02 million shares exchanged hands for the day, well above to its average volume of 14.49 million shares. The stock opened at $20.37 and moved within a range of $19.68 – 21.75.
SPCE Release News This Week
Virgin Galactic Confirms Upcoming Test Flight of VSS Unity in May
- SPCE confirmed that the next rocket-powered test flight of SpaceShipTwo Unity will be conducted on May 22, pending weather and technical checks. This follows the completion of a maintenance review of VMS Eve, the mothership jet aircraft designed to carry SpaceShipTwo to an altitude of approximately 50,000 feet.
- Virgin Galactic regularly monitors its vehicles to verify their condition and inform timing of future upgrades and modifications that can improve performance or reduce future maintenance work.
- A post-flight inspection of VMS Eve in early May called for further engineering analysis to assess a known maintenance item in the tail of the vehicle, which was scheduled to be addressed during the next maintenance period. This analysis has been completed with the Company determining structures healthy, clearing Eve for flight.
“Following a detailed inspection and thorough analysis of our mothership, Eve, we have cleared our Spaceflight System for our upcoming flight. I want to thank our incredibly talented team of engineers, maintenance crew, quality inspectors and support staff for their diligence and hard work, which is testament to our commitment to safety and the integrity of our flight test program,” said Michael Colglazier, Chief Executive Officer of Virgin Galactic.
Trader Notes
Share Information
| SHARES OUTSTANDING | 257.96 M |
| SHARE FLOAT (%) | 163.63 M (63.43%) |
| % HELD BY INSTITUTIONS | 24.35 |
Recent Stock Performance
| 5-DAY PERF. | +30.22% |
| 1-MONTH PERF. | -5.35% |
| 3-MONTH PERF. | -58.84% |
| 6-MONTH PERF. | -9.61% |
| YTD PERF. | -11.21% |
| 1-YEAR PERF. | +43.24% |
Moving Averages
| +/- EMA(20) | 19.73 (+6.79%) |
| +/- SMA(50) | 24.95 (-15.55%) |
| +/- SMA(200) | 26.42 (-20.25%) |
Pivot Points
| Name | S3 | S2 | S1 | Pivot Points | R1 | R2 | R3 |
| Classic | 17.8467 | 18.7633 | 19.9167 | 20.8333 | 21.9867 | 22.9033 | 24.0567 |
| Fibonacci | 18.7633 | 19.5541 | 20.0426 | 20.8333 | 21.6241 | 22.1126 | 22.9033 |
Technical Indicators
| Symbol | Value | Result | Symbol | Value | Result |
| ADX | 29.6917 | Sell | ATR14 | 2.2479 | |
| CCI20 | 41.2896 | Neutral | Chaikin Money Flow | 0.0347 | Neutral |
| MACD | -2.6015 | Sell | Money Flow Index | 61.0573 | Buy |
| ROC | 5.6670 | Buy | RSI | 48.5752 | Buy |
| STOCH (14,3) | 90.9091 | OverBought | STOCH RSI | 1.0000 | OverBought |
| UO | 58.0634 | Buy | Williams %R | -9.0909 | OverBought |


