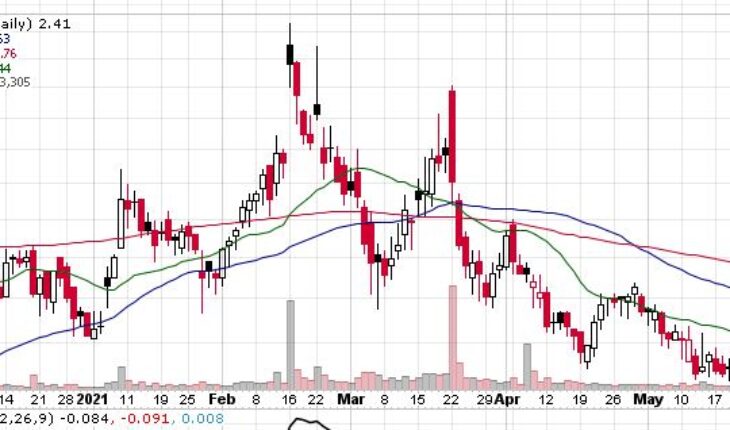
Strongbridge Biopharma plc (NASDAQ:SBBP) is one of the most active stock gainers in the pre-market session on acquisition news.
Market Action
As of 7.10, SBBP stock is trading higher by 48 cents or 19.92% to $2.89 in the pre-market session with more than 700K shares have traded hands.
SBBP Releases News Today
Xeris Pharmaceuticals, Inc. to Acquire Strongbridge Biopharma plc in Stock and CVR Transaction, Creating an Innovative Leader in Endocrinology and Rare Diseases
- Xeris Pharmaceuticals, Inc. (“Xeris”) (Nasdaq: XERS), a pharmaceutical company leveraging its novel formulation technology platforms to develop and commercialize ready-to-use injectable drug formulations, and Strongbridge Biopharma plc (“Strongbridge”) (Nasdaq: SBBP), a global commercial-stage biopharmaceutical company focused on the development and commercialization of therapies for rare diseases with significant unmet needs, today announced that they have entered into a definitive agreement under which Xeris will acquire Strongbridge for stock and contingent value rights (“CVRs”).
- The agreement, including the maximum aggregate amount payable under the CVRs, values Strongbridge at approximately $267 million based on the closing price of Xeris common stock of $3.47 on May 21, 2021 and Strongbridge’s fully diluted share capital. The transaction, which has been unanimously approved by the boards of directors of both companies, with the exception of Jeffrey W. Sherman, M.D., a director in common to both companies, who abstained from the voting, is expected to close early in the fourth quarter of 2021, subject to the satisfaction of closing conditions. Upon close of the transaction, the businesses of Xeris and Strongbridge will be combined under a new entity to be called Xeris Biopharma Holdings, Inc. (“Xeris Biopharma Holdings”).
Trader Notes
Share Information
| SHARES OUTSTANDING | 67.59 M |
| SHARE FLOAT (%) | 52.59 M (77.81%) |
| % HELD BY INSTITUTIONS | 44.56 |
Recent Stock Performance
| 5-DAY PERF. | +2.55% |
| 1-MONTH PERF. | -3.21% |
| 3-MONTH PERF. | -29.94% |
| 6-MONTH PERF. | -10.41% |
| YTD PERF. | -0.82% |
| 1-YEAR PERF. | -31.73% |
Moving Averages
| +/- EMA(20) | 2.41 (+0.00%) |
| +/- SMA(50) | 2.63 (-8.37%) |
| +/- SMA(200) | 2.76 (-12.68%) |
Pivot Points
| Name | S3 | S2 | S1 | Pivot Points | R1 | R2 | R3 |
| Classic | 2.2133 | 2.2567 | 2.3333 | 2.3767 | 2.4533 | 2.4967 | 2.5733 |
| Fibonacci | 2.2567 | 2.3025 | 2.3308 | 2.3767 | 2.4225 | 2.4508 | 2.4967 |
Technical Indicators
| Symbol | Value | Result | Symbol | Value | Result |
| ADX | 12.6954 | Neutral | ATR14 | 0.1311 | |
| CCI20 | -37.3549 | Neutral | Chaikin Money Flow | 0.1239 | Buy |
| MACD | -0.1009 | Sell | Money Flow Index | 32.1372 | Sell |
| ROC | -1.2295 | Sell | RSI | 46.3745 | Buy |
| STOCH (14,3) | 51.5152 | Buy | STOCH RSI | 1.0000 | OverBought |
| UO | 50.0508 | Sell | Williams %R | -48.4848 | Neutral |
