Invesco Mortgage Capital Inc (NYSE:IVR) is moving lower Friday’s trading session.
Market Action
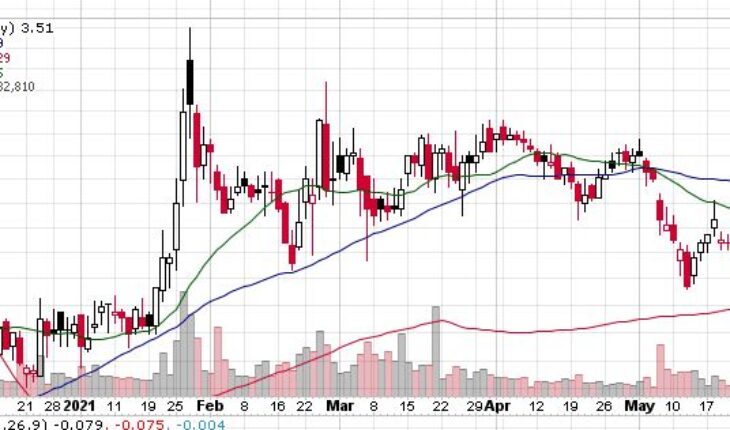
As of 12:47, IVR stock fell 0.42% to $3.515. The stock has traded 2.01 million, compared to its average volume of 7.80 million shares. After opening at $3.53, the stock has moved within a wide range of $3.4601 – 3.5500.
IVR Business Description
Invesco Mortgage Capital Inc. operates as a real estate investment trust (REIT) that primarily focuses on investing in, financing, and managing mortgage-backed securities and other mortgage-related assets. It invests in residential mortgage-backed securities (RMBS) and commercial mortgage-backed securities (CMBS) that are guaranteed by a U.S. government agency or federally chartered corporation; RMBS and CMBS that are not issued or guaranteed by a U.S. government agency or federally chartered corporation; credit risk transfer securities that are unsecured obligations issued by government-sponsored enterprises; residential and commercial mortgage loans; and other real estate-related financing arrangements.
Invesco Mortgage Capital Inc. has elected to be taxed as a REIT and would not be subject to federal corporate income taxes if it distributes at least 90% of its taxable income to its stockholders. The company was formally known as Invesco Agency Securities Inc. and changed its name to Invesco Mortgage Capital Inc. in June 2008. Invesco Mortgage Capital Inc. was incorporated in 2008 and is headquartered in Atlanta, Georgia.
Trader Notes
Share Information
| SHARES OUTSTANDING | 246.40 M |
| SHARE FLOAT (%) | 245.77 M (99.74%) |
| % HELD BY INSTITUTIONS | 58.00 |
Recent Stock Performance
| 5-DAY PERF. | -1.68% |
| 1-MONTH PERF. | -7.87% |
| 3-MONTH PERF. | -13.50% |
| 6-MONTH PERF. | +5.29% |
| YTD PERF. | +8.72% |
| 1-YEAR PERF. | +35.80% |
Moving Averages
| +/- EMA(20) | 3.62 (-3.04%) |
| +/- SMA(50) | 3.79 (-7.39%) |
| +/- SMA(200) | 3.29 (+6.69%) |
Pivot Points
| Name | S3 | S2 | S1 | Pivot Points | R1 | R2 | R3 |
| Classic | 3.4733 | 3.4967 | 3.5133 | 3.5367 | 3.5533 | 3.5767 | 3.5933 |
| Fibonacci | 3.4967 | 3.5119 | 3.5214 | 3.5367 | 3.5519 | 3.5614 | 3.5767 |
Technical Indicators
| Symbol | Value | Result | Symbol | Value | Result |
| ADX | 11.2759 | Neutral | ATR14 | 0.1178 | |
| CCI20 | -59.1444 | Sell | Chaikin Money Flow | -0.1287 | Sell |
| MACD | -0.0721 | Sell | Money Flow Index | 25.1501 | Sell |
| ROC | -7.1053 | Sell | RSI | 40.0427 | Sell |
| STOCH (14,3) | 32.0755 | Buy | STOCH RSI | 0.5158 | Neutral |
| UO | 52.7968 | Buy | Williams %R | -67.9245 | Neutral |


