Cellect Biotechnology Ltd (NASDAQ:APOP) is moving higher in Monday’s session.
Market Action
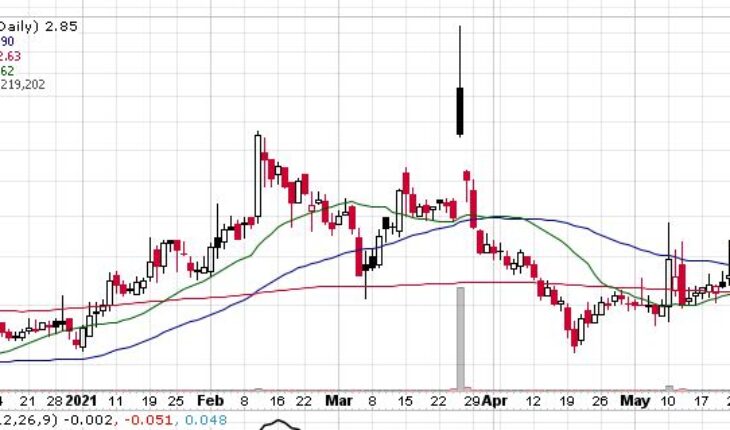
As of 1:13, APOP stock rose 1.42% to $2.84. The stock has traded 1.22 million shares, compared to its average volume of 2.09 million shares. The stock has moved within a wide range of $2.7300 – 3.2000 and opened at $2.85.
APOP Business Description
Cellect Biotechnology Ltd., a biotechnology company, engages in developing ApoGraft, a technology platform that functionally selects stem cells to enhance the safety of regenerative medicine and stem cell therapies in Israel. The company develops ApoTainer, a kit for hematopoietic stem cell transplantation procedures.
It has collaborations with the denovoMATRIX group of the Technische Universität Dresden to conduct examinations into the tentative synergy between ApoGraft and denovoMAtrix technology for the purpose of evaluating collaborative development of products for regenerative medicine; Cell2in Inc. to conduct scientific evaluations combining ApoGraft with Cell2in’s identification technology FreSHtracer, which monitors stem cell quality by utilizing a fluorescent dye to characterize their oxidative stress state; and XNK therapeutics to focus on the development of cell-based therapeutics from NK cells. The company was formerly known as Cellect Biomed Ltd. and changed its name to Cellect Biotechnology Ltd. in July 2016. Cellect Biotechnology Ltd. was incorporated in 1986 and is headquartered in Kfar Saba, Israel.
Trader Notes
Share Information
| SHARES OUTSTANDING | 3.91 M |
| SHARE FLOAT (%) | 1.12 M (28.62%) |
| % HELD BY INSTITUTIONS | 11.51 |
Recent Stock Performance
| 5-DAY PERF. | +5.97% |
| 1-MONTH PERF. | +17.36% |
| 3-MONTH PERF. | -23.66% |
| 6-MONTH PERF. | +48.69% |
| YTD PERF. | +31.48% |
| 1-YEAR PERF. | -2.41% |
Moving Averages
| +/- EMA(20) | 2.68 (+5.97%) |
| +/- SMA(50) | 2.90 (-2.07%) |
| +/- SMA(200) | 2.63 (+7.98%) |
Pivot Points
| Name | S3 | S2 | S1 | Pivot Points | R1 | R2 | R3 |
| Classic | 2.1000 | 2.4000 | 2.6000 | 2.9000 | 3.1000 | 3.4000 | 3.6000 |
| Fibonacci | 2.4000 | 2.5910 | 2.7090 | 2.9000 | 3.0910 | 3.2090 | 3.4000 |
Technical Indicators
| Symbol | Value | Result | Symbol | Value | Result |
| ADX | 21.1166 | Neutral | ATR14 | 0.2874 | |
| CCI20 | 169.6374 | Buy | Chaikin Money Flow | -0.1357 | Sell |
| MACD | -0.0185 | Sell | Money Flow Index | 69.7736 | Buy |
| ROC | 11.5538 | Buy | RSI | 55.3353 | Buy |
| STOCH (14,3) | 43.6364 | Buy | STOCH RSI | 1.0000 | OverBought |
| UO | 43.0897 | Buy | Williams %R | -56.3636 | Neutral |


