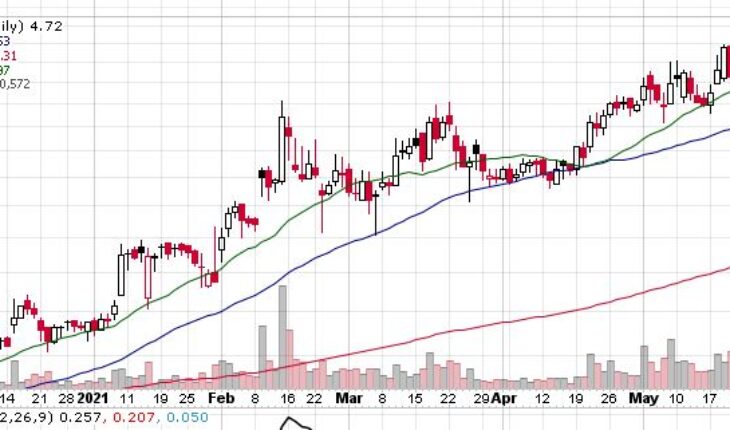
Diana Shipping Inc (NYSE:DSX) is moving higher and now trading at session high.
Market Action
As of 11:06, DSX stock rose 6.15% to $4.66. The stock has traded 927K shares, compared to its average volume of 1.04 million shares. After opening at $4.40, the stock has moved within a wide range of $ 4.3900 – 4.6700.
DSX Had News Last Week
May 21, 2021 Diana Shipping Inc. Announces Results of 2021 Annual Meeting of Shareholders
- DSX announced that the Company’s Annual Meeting of Shareholders (the “Meeting”) was duly held on May 20, 2021, in a virtual format only via the Internet, pursuant to a Notice of Annual Meeting of Shareholders dated April 9, 2021. Broadridge Financial Solutions, Inc. acted as inspector of the Meeting.
- At the Meeting, each of the following proposals, which are set forth in more detail in the Notice of Annual Meeting of Shareholders and the Company’s Proxy Statement sent to shareholders on or around April 9, 2021, was approved and adopted:
- (1) The election of Simeon Palios, Anastasios Margaronis and Ioannis Zafirakis as Class I Directors of the Company, to serve until the Company’s 2024 Annual Meeting of Shareholders;
- (2) The appointment of Ernst & Young (Hellas) Certified Auditors Accountants S.A. as the Company’s independent auditors for the fiscal year ending December 31, 2021; and
- (3) The amendment to the Company’s Amended and Restated Articles of Incorporation to effect a reverse stock split of the Company’s issued Common Shares, at a ratio of not less than one-for-two and not more than one-for-ten, and to authorize the Board of Directors to implement the reverse stock split by filing an amendment to the Company’s Amended and Restated Articles of Incorporation with the Registrar of Corporations of the Republic of the Marshall Islands.
Trader Notes
Share Information
| SHARES OUTSTANDING | 91.54 M |
| SHARE FLOAT (%) | 65.29 M (71.33%) |
| % HELD BY INSTITUTIONS | 22.12 |
Recent Stock Performance
| 5-DAY PERF. | +20.67% |
| 1-MONTH PERF. | +29.36% |
| 3-MONTH PERF. | +59.39% |
| 6-MONTH PERF. | +176.33% |
| YTD PERF. | +141.97% |
| 1-YEAR PERF. | +226.57% |
Moving Averages
| +/- EMA(20) | 3.98 (+17.34%) |
| +/- SMA(50) | 3.52 (+32.67%) |
| +/- SMA(200) | 2.31 (+102.16%) |
Pivot Points
| Name | S3 | S2 | S1 | Pivot Points | R1 | R2 | R3 |
| Classic | 3.9100 | 4.0100 | 4.2000 | 4.3000 | 4.4900 | 4.5900 | 4.7800 |
| Fibonacci | 4.0100 | 4.1208 | 4.1892 | 4.3000 | 4.4108 | 4.4792 | 4.5900 |
Technical Indicators
| Symbol | Value | Result | Symbol | Value | Result |
| ADX | 19.1117 | Neutral | ATR14 | 0.3150 | |
| CCI20 | 154.0145 | Buy | Chaikin Money Flow | 0.0195 | Neutral |
| MACD | 0.2430 | Buy | Money Flow Index | 56.3304 | Sell |
| ROC | 15.5263 | Buy | RSI | 63.6333 | Sell |
| STOCH (14,3) | 89.3617 | OverBought | STOCH RSI | 0.5938 | Neutral |
| UO | 53.8905 | Buy | Williams %R | -10.6383 | OverBought |


