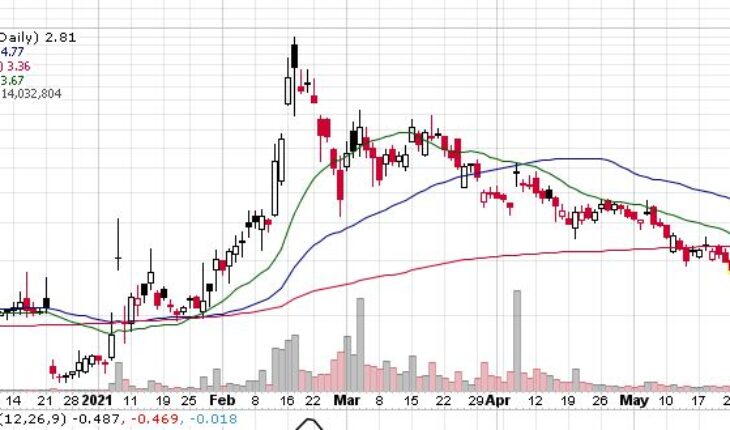
SOS Limited (NYSE:SOS) stock continues to trade lower on Monday. The stock has been in downtrend since Faberuary.
Market Action
As of 11:39, SOS stock slide 5.21% at $2.81. The stock has traded 14.10 million shares, compared to its average volume of 59.49 million shares. The stock opened at $3 and moved in a range of $2.7500 – 2.9900.
SOS Business Description
- SOS Limited provides data mining and analysis services to corporate and individual members in the People’s Republic of China. It provides marketing data, technology, and solutions for insurance companies; emergency rescue services; and insurance product and health care information portals.
- The company operates SOS cloud emergency rescue service software as a service platform that offers basic cloud products, such as medical rescue, auto rescue, financial rescue, and life rescue cards; cooperative cloud systems, including information rescue center, intelligent big data, and intelligent software and hardware; and information cloud systems, such as Information Today and E-commerce Today, as well as 10086 hot-line and promotional center for Guangdong Bank of Development.
- It also focuses on cryptocurrency mining, blockchain-based insurance, and security management businesses. The company serves insurance companies, financial institutions, medical institutions, healthcare providers, and other service providers in the emergency rescue services industry. SOS Limited is headquartered in Qingdao, the People’s Republic of China.
Trader Notes
Share Information
| SHARES OUTSTANDING | 121.53 M |
| SHARE FLOAT (%) | 58.97 M (48.53%) |
| % HELD BY INSTITUTIONS | 3.74 |
Recent Stock Performance
| 5-DAY PERF. | -13.80% |
| 1-MONTH PERF. | -35.10% |
| 3-MONTH PERF. | -62.93% |
| 6-MONTH PERF. | +35.75% |
| YTD PERF. | +89.86% |
| 1-YEAR PERF. | +119.53% |
Moving Averages
| +/- EMA(20) | 3.60 (-21.94%) |
| +/- SMA(50) | 4.77 (-41.09%) |
| +/- SMA(200) | 3.36 (-16.37%) |
Pivot Points
| Name | S3 | S2 | S1 | Pivot Points | R1 | R2 | R3 |
| Classic | 2.5433 | 2.7567 | 2.8633 | 3.0767 | 3.1833 | 3.3967 | 3.5033 |
| Fibonacci | 2.7567 | 2.8789 | 2.9544 | 3.0767 | 3.1989 | 3.2744 | 3.3967 |
Technical Indicators
| Symbol | Value | Result | Symbol | Value | Result |
| ADX | 43.5837 | Sell | ATR14 | 0.4382 | |
| CCI20 | -96.0679 | Sell | Chaikin Money Flow | -0.2684 | Sell |
| MACD | -0.4997 | Sell | Money Flow Index | 29.7215 | Buy |
| ROC | -30.4450 | Sell | RSI | 27.0897 | OverSold |
| STOCH (14,3) | 3.8251 | OverSold | STOCH RSI | 0.4898 | Neutral |
| UO | 38.2779 | Buy | Williams %R | -96.1749 | OverSold |
