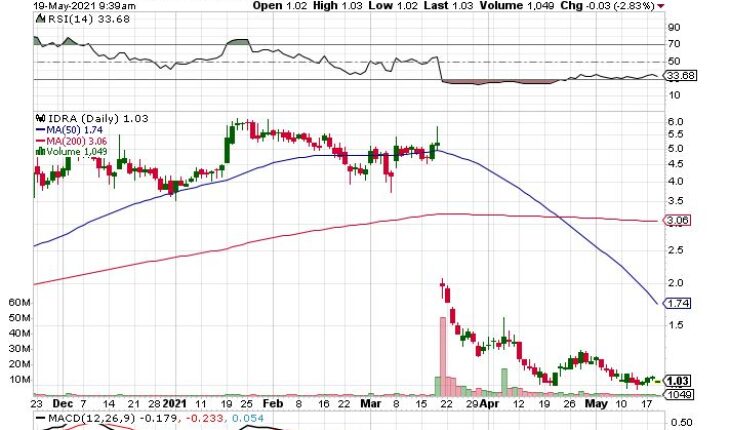
Idera Pharmaceuticals Inc (NASDAQ:IDRA) has been trading around its 52-week low.
Market Action
As of 10:10 IDRA is trading at 1.02. down .04 losing 3.7% so far on the day. Volume is 257k shares. IDRA opened at 1 and has traded in a range between 1.00 and 1.05.
Idera Pharmaceuticals Provides Updates
- IDRA will discontinue the trail of tilsotolimod in combination with ipilimumab versus ipilimumab alone in patients with anti-PD-1 refractory advanced melanoma, to its overall survival (OS) primary endpoint
- Tilsotolimod with ipilimumabis not expected to achieve a statistically significant OS benefit over ipilimumab alone
- The trial failed to meet the expected results as announces in March
- Full results from the study will be presented in a future publication
CEO Vincent Milano commented “We remain committed to our additional trials and are continuing to enroll and treat patients in ILLUMINATE-206, our Phase 2 study of tilsotolimod in combination with BMS’s nivolumab and ipilimumab for patients with microsatellite-stable colorectal cancer and to support AbbVie in the form of study drug in their trial for patients with head and neck squamous cell carcinoma.”
Trader Notes
Share Information
| REVENUE PER SHARE (TTM) | 0.00 |
| SHARES OUTSTANDING | 50.03 M |
| SHARE FLOAT (%) | 38.71 M (77.37%) |
Recent Stock Performance
| 5-DAY PERF. | -1.85% |
| 1-MONTH PERF. | -3.64% |
| 3-MONTH PERF. | -78.14% |
| 6-MONTH PERF. | -68.17% |
| YTD PERF. | -71.12% |
| 1-YEAR PERF. | -41.44% |
Moving Averages
| +/- EMA(20) | 1.16 (-8.62%) |
| +/- SMA(50) | 1.82 (-41.76%) |
| +/- SMA(200) | 3.06 (-65.36%) |
Pivot Points
| Name | S3 | S2 | S1 | Pivot Points | R1 | R2 | R3 |
| Classic | 1.0133 | 1.0267 | 1.0433 | 1.0567 | 1.0733 | 1.0867 | 1.1033 |
| Fibonacci | 1.0267 | 1.0381 | 1.0452 | 1.0567 | 1.0681 | 1.0752 | 1.0867 |
Technical Indicators
| Symbol | Value | Result | Symbol | Value | Result |
| ADX | 12.8340 | Neutral | ATR14 | 0.1387 | |
| CCI20 | -57.2276 | Sell | Chaikin Money Flow | 0.1416 | Buy |
| MACD | -0.4439 | Sell | Money Flow Index | 32.4252 | Sell |
| ROC | -10.1695 | Sell | RSI | 46.2566 | Buy |
| STOCH (14,3) | 30.7958 | Sell | STOCH RSI | 1.0000 | OverBought |
| UO | 51.6717 | Buy | Williams %R | -69.2042 | Neutral |


