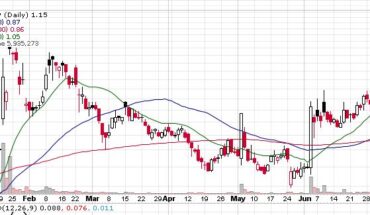
Polarityte Inc (NASDAQ:PTE) gapped up this morning on high volume.
Market Action
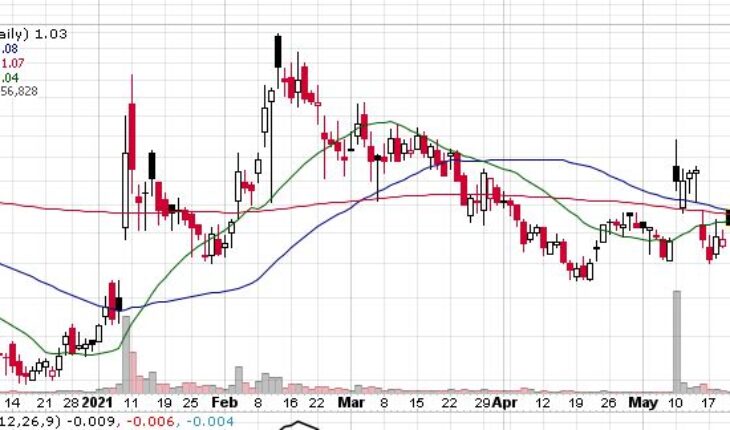
As of 10:05, PTE stock is moving higher by over 6% to $1.04. The stock has traded 604K shares, compared to its average volume of 4.80 million shares. The stock opened at $1.08 and moved in a range of $1.0300 – 1.0800.
PTE Released News Last Week
PolarityTE Reports First Quarter Results and Provides Business Update
- Net revenues increased by 405% to $4.71 million for the three-month period ended March 31, 2021, compared to $0.93 million for the same period in 2020.
- Total operating costs and expenses decreased to $10.75 million for the three-month period ended March 31, 2021, compared to $18.12 million for the same period in 2020, a decrease of 41%.
- Our operating loss decreased from an operating loss of $17.71 million for the three-month period ended March 31, 2020, to an operating loss of $8.21 million for the comparable period in 2021. Net loss, however, increased from $13.04 million for the three-month period ended March 31, 2020, to $17.41 million for the comparable period in 2021.
Richard Hague, President & COO, commented, “Our team firmly believes that a successful BLA for SkinTE will create a highly valuable asset based on the clinical data that will support our eventual BLA submission, which should drive widespread adoption, enable favorable payer coverage and clear marketing claims, and provide regulatory exclusivity if SkinTE is deemed a reference product.
Trader Notes
Share Information
| SHARES OUTSTANDING | 80.59 M |
| SHARE FLOAT (%) | 66.08 M (81.99%) |
| % HELD BY INSTITUTIONS | 16.94 |
Recent Stock Performance
| 5-DAY PERF. | -16.53% |
| 1-MONTH PERF. | +20.15% |
| 3-MONTH PERF. | -34.49% |
| 6-MONTH PERF. | +12.51% |
| YTD PERF. | +52.21% |
| 1-YEAR PERF. | +24.10% |
Moving Averages
| +/- EMA(20) | 1.04 (-0.96%) |
| +/- SMA(50) | 1.08 (-4.63%) |
| +/- SMA(200) | 1.07 (-3.74%) |
Pivot Points
| Name | S3 | S2 | S1 | Pivot Points | R1 | R2 | R3 |
| Classic | 7.8900 | 8.0200 | 8.1500 | 8.2800 | 8.4100 | 8.5400 | 8.6700 |
| Fibonacci | 8.0200 | 8.1193 | 8.1807 | 8.2800 | 8.3793 | 8.4407 | 8.5400 |
Technical Indicators
| Symbol | Value | Result | Symbol | Value | Result |
| ADX | 24.0812 | Neutral | ATR14 | 0.5572 | |
| CCI20 | 57.4152 | Buy | Chaikin Money Flow | 0.1980 | Buy |
| MACD | 0.4162 | Buy | Money Flow Index | 67.8190 | Sell |
| ROC | 12.0433 | Buy | RSI | 60.8666 | Sell |
| STOCH (14,3) | 67.1053 | Sell | STOCH RSI | 0.0000 | OverSold |
| UO | 55.4825 | Sell | Williams %R | -32.8947 | Neutral |
