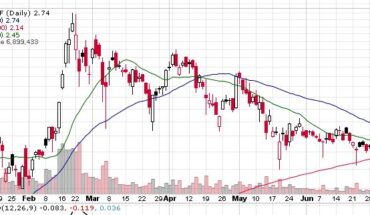
NexTech AR Solutions Corp. (OTCMKTS:NEXCF) has built some momentum on Thursday.
Market Action
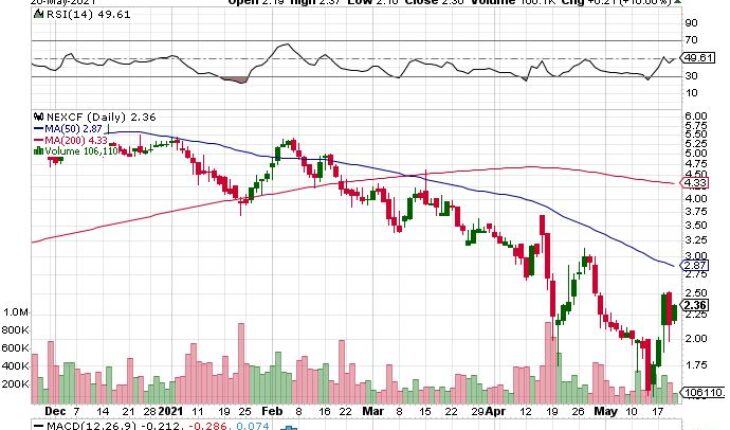
On Thursday, NEXCF stock closed at $2.36 gained 10% to $0.2146. The stock has a total volume of 106K shares, which is half of its average volume 260K. NEXCF has moved in a range of $2.160 – $2.369 after opening at $2.194.
NEXCF Latest Developments
NexTech AR Solutions Corp. announces a new event.
- NexTech AR Solutions Corp.(OTCMKTS:NEXCF) announces a new LiveX showcase event featuring guest speaker Gary Vee.
- LiveX enables users Augmented Digital Experiences, AR E-Commerce, AR Advertising, and AR Products. The company’s innovation team is also working on NFT Technology on LiveX.
- The event is scheduled for June 29, 2021, at 10:00 a.m. Eastern time.
Evan Gappelberg, CEO of Nextech, comments: “We are really excited about our signature customer event on our own Digital Experience Platform LiveX and the news and innovations we have to share with our customers, partners, investors, and young talents. We are at a truly unbelievable speed of product releases delivering more innovations in Augmented Reality than ever before. Starting with AR Livestreaming Holograms, as well as AR 3D Object Creation with Artificial Intelligence, and Augmented Reality NFTs just to name a few. We are thrilled to welcome Gary to our LiveX platform and hear him speak at our signature event LiveNow where we will all be crossing the digital divide together. This is a very exciting event where likeminded entrepreneurs will speak to the exciting new world of experience-based technologies like AR and NFTs “. He continues, “With the NFT enabled on the LiveX platform, we will have five AR enabled business units: AR eCommerce, AR Ad Network, Augmented Digital Experiences, AR Product showcases, and an exclusive creators AR NFT-enabled Marketplace which further positions us to be a leader in the Augmented Reality industry.”
Trader Notes
Share Information
| SHARES OUTSTANDING | 42.84 M |
| SHARE FLOAT (%) | 36.13 M (84.34%) |
| % HELD BY INSTITUTIONS | 6.23 |
Recent Stock Performance
| 5-DAY PERF. | +52.26% |
| 1-MONTH PERF. | +7.76% |
| 3-MONTH PERF. | -43.94% |
| 6-MONTH PERF. | -58.13% |
| YTD PERF. | -55.05% |
| 1-YEAR PERF. | +42.17% |
Moving Averages
| +/- EMA(20) | 2.26 (+4.42%) |
| +/- SMA(50) | 2.87 (-17.77%) |
| +/- SMA(200) | 4.33 (-45.50%) |
Pivot Points
| Name | S3 | S2 | S1 | Pivot Points | R1 | R2 | R3 |
| Classic | 2.0135 | 2.0867 | 2.2234 | 2.2966 | 2.4333 | 2.5065 | 2.6432 |
| Fibonacci | 2.0867 | 2.1669 | 2.2165 | 2.2966 | 2.3768 | 2.4264 | 2.5065 |
Technical Indicators
| Symbol | Value | Result | Symbol | Value | Result |
| ADX | 26.4992 | Sell | ATR14 | 0.3432 | |
| CCI20 | 12.6831 | Neutral | Chaikin Money Flow | -0.0083 | Neutral |
| MACD | -0.2748 | Sell | Money Flow Index | 29.2150 | Sell |
| ROC | 10.7981 | Buy | RSI | 49.7720 | Buy |
| STOCH (14,3) | 83.3414 | OverBought | STOCH RSI | 0.9075 | OverBought |
| UO | 58.3181 | Buy | Williams %R | -16.6586 | OverBought |
