Aptorum Group Ltd (NASDAQ:APM) stock is trading sharply higher on Monday.
Market Action
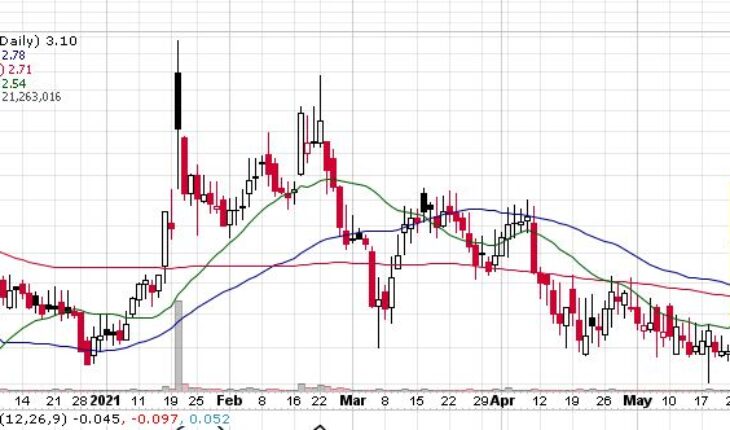
As of 10:48, APM stock gained by 63 cents or 26.46% at $3.10. The stock has traded 21.39 million shares, well above its average volume of 216K shares. The stock opened at $2.6115 and moved in a range of $2.5800 – 3.5400.
APM Releases News
Aptorum Group Announces Positive Interim Phase I Clinical Trial Progress for ALS-4 Targeting Staphylococcus aureus and Positive Pre-IND Progress for SACT-1 Targeting Neuroblastoma
- APM announces positive progress in respect of: (i) its ongoing Phase I clinical trial for ALS-4 (a first in-class anti-virulence approach based small molecule targeting Staphylococcus aureus, including, but not limited to Methicillin Resistant Staphylococcus Aureus (“MRSA”)), under which two initial cohorts of the single dose ascending dose (SAD) portion of the trial in healthy male and female adult subjects have been completed with no serious adverse events observed (with in total 6 cohorts for SAD and 3 cohorts for multiple ascending dose (MAD) have been planned); and (ii) its ongoing Pre-IND preparation for SACT-1, a repurposed small molecule targeting neuroblastoma, under which the Pre-IND meeting with the US FDA has been completed.
- ALS-4’s first-in-human Phase I trial is a randomized, double-blinded, placebo-controlled, single and multiple ascending dose study designed to evaluate safety, tolerability, and pharmacokinetics of orally administered ALS-4 in healthy male and female adult volunteers.
Trader Notes
Share Information
| SHARES OUTSTANDING | 34.19 M |
| SHARE FLOAT (%) | 8.97 M (26.24%) |
| % HELD BY INSTITUTIONS | 0.58 |
Recent Stock Performance
| 5-DAY PERF. | +24.59% |
| 1-MONTH PERF. | +21.12% |
| 3-MONTH PERF. | -13.39% |
| 6-MONTH PERF. | +26.67% |
| YTD PERF. | +23.08% |
| 5-DAY PERF. | +24.59% |
Moving Averages
| +/- EMA(20) | 2.56 (+18.75%) |
| +/- SMA(50) | 2.78 (+9.35%) |
| +/- SMA(200) | 2.71 (+12.18%) |
Pivot Points
| Name | S3 | S2 | S1 | Pivot Points | R1 | R2 | R3 |
| Classic | 5.8067 | 5.8933 | 5.9467 | 6.0333 | 6.0867 | 6.1733 | 6.2267 |
| Fibonacci | 5.8933 | 5.9468 | 5.9799 | 6.0333 | 6.0868 | 6.1199 | 6.1733 |
Technical Indicators
| Symbol | Value | Result | Symbol | Value | Result |
| ADX | 20.1924 | Neutral | ATR14 | 0.2113 | |
| CCI20 | -46.5116 | Neutral | Chaikin Money Flow | 0.0206 | Neutral |
| MACD | -0.1122 | Sell | Money Flow Index | 11.9733 | OverSold |
| ROC | -6.8323 | Sell | RSI | 42.7363 | Buy |
| STOCH (14,3) | 41.8605 | Buy | STOCH RSI | 0.9348 | OverBought |
| UO | 49.2127 | Buy | Williams %R | -58.1395 | Neutral |


