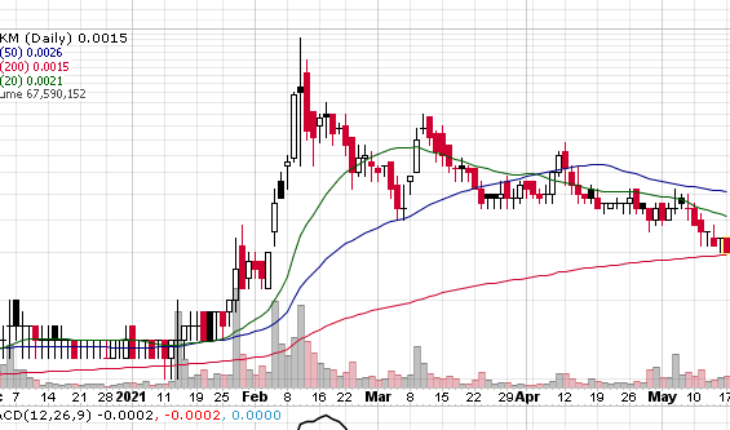
Alkame Holdings Inc (OTCMKTS:ALKM) is trading weak in Monday’s trading session. AKLM has not had an up day in 8 sessions. When will it stop?
Market Action
As of 2:54, ALKM stock is trading lower by 9.71% or $0.0002 to $0.0015. So far more than 67.59 million shares have traded, above its 30-day average volume of 64.66 million shares. The stock opened at $0.0017 and moved within a narrow range of $0.0015-$0.0017.
ALKM News Highlights for Monday
Alkame To Develop and Produce Complete Beverage Line for Simple Beverages
- ALKM announced that Simple Beverages LLC has teamed up with West Coast Copacker to add additional products to its beverage line. West Coast Co packer will create, formulate, and produce three additional CBD (cannabinoid) infused beverages.
- Simple Beverage worked with Alkame on developing and bringing to market their first of several beverage products, Lemon-Aide, a coconut lemonade with 25mg of CBD in a 12oz glass bottle.
- The success of their initial product has led to West Coast Co-Packer to begin the development of the next three beverages that Simple Beverage wants to bring to market.
- The next three will be a sweet tea, coconut lime lemonade, and a half and half iced tea and lemonade, all infused with 25mg of CBD in a 12oz glass bottle.
“The Alkame team has been phenomenal to work with and we look forward to continuing our relationship with them as we bring to market our additional products” stated Simple Beverage co-owner Gabe Head.
Trader Notes
Share Information
| SHARES OUTSTANDING | 5,500 M |
| SHARE FLOAT (%) | 5,499.05 M (99.98%) |
| % HELD BY INSTITUTIONS | 0.00 |
Recent Stock Performance
| 5-DAY PERF. | -21.05% |
| 1-MONTH PERF. | -37.50% |
| 3-MONTH PERF. | -69.39% |
| 6-MONTH PERF. | +114.29% |
| YTD PERF. | +114.29% |
| 1-YEAR PERF. | +200.00% |
Moving Averages
| +/- EMA(20) | 0.0020 (-25.00%) |
| +/- SMA(50) | 0.0026 (-42.31%) |
| +/- SMA(200) | 0.0015 (+0.00%) |
Pivot Points
| Name | S3 | S2 | S1 | Pivot Points | R1 | R2 | R3 |
| Classic | 0.0014 | 0.0014 | 0.0016 | 0.0016 | 0.0018 | 0.0018 | 0.0020 |
| Fibonacci | 0.0014 | 0.0015 | 0.0016 | 0.0016 | 0.0017 | 0.0018 | 0.0018 |
Technical Indicators
| Symbol | Value | Result | Symbol | Value | Result |
|---|---|---|---|---|---|
| ADX | 44.8866 | Buy | ATR14 | 0.0005 | |
| CCI20 | -178.5064 | Sell | Chaikin Money Flow | -0.1074 | Sell |
| MACD | -0.0002 | Sell | Money Flow Index | 44.8116 | Sell |
| ROC | -22.7273 | Sell | RSI | 40.4604 | Sell |
| STOCH (14,3) | 18.1818 | OverSold | STOCH RSI | 0.2147 | Sell |
| UO | 38.1081 | Sell | Williams %R | -81.8182 | OverSold |


