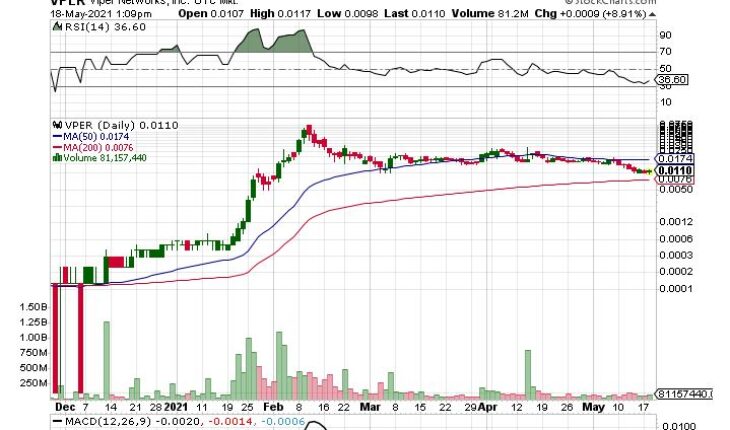
Viper Networks Inc. (OTCMKTS:VPER) is up a bit in Tuesday’s session but has been under pressure the last few months. Since April the stock is down over 50%. There should be some support here as it is a high from January and a low from March. There is a possibility of a bounce here. If it doesn’t materialize, look out below.
Market Action
As of 12:49, VPER is moving up 10.4% to trade at $0.0111. So far more than 79.38 million shares have exchanged hands, 75% its 30-day average volume of 103.65 million shares. The stock opened at $0.0107 and moved in a range of $0.0098 – $0.0117.
VPER Announces Big Partnership
- Viper Networks Inc. has announced a partnership with the local service provider of Sri Lanka Telecom, Bharti Airtel and Hutch to launch a 100 million phase 1 smart city project in Sri Lanka.
- The project will start with the installation of an LED light pole at colleges and universities throughout Colombo which is the commercial capital and the largest city in Sri Lanka.
- After completing the initial plan the company will start on a broader implication of the plan for the entire county. The Sri Lankan contract with the local service provider viper networks’ Apollo Smart Pole digital hub to manage securities camera, information panel, etc.
- Viper Networks is also expected to launch its CyberGrab app platform for Sri Lanka. CyberGrab is an all-in-one platform app which will include ride-sharing services to grocery and common bill payment.
Trader Notes
Share Information
| SHARES OUTSTANDING | 5,928.85 M |
| SHARE FLOAT (%) | 5,483.12 M (92.48%) |
| % HELD BY INSTITUTIONS | 0.01 |
Recent Stock Performance
| 5-DAY PERF. | -22.14% |
| 1-MONTH PERF. | -48.34% |
| 3-MONTH PERF. | -50.45% |
| 6-MONTH PERF. | +10800.00% |
| YTD PERF. | +2080.00% |
| 1-YEAR PERF. | +0.00% |
Moving Averages
| +/- EMA(20) | 0.0146 (-25.34%) |
| +/- SMA(50) | 0.0174 (-37.36%) |
| +/- SMA(200) | 0.0076 (+43.42%) |
Pivot Points
| Name | S3 | S2 | S1 | Pivot Points | R1 | R2 | R3 |
| Classic | 0.0082 | 0.0092 | 0.0096 | 0.0106 | 0.0110 | 0.0120 | 0.0124 |
| Fibonacci | 0.0092 | 0.0097 | 0.0100 | 0.0106 | 0.0111 | 0.0114 | 0.0120 |
Technical Indicators
| Symbol | Value | Result | Symbol | Value | Result |
| ADX | 50.5184 | Buy | ATR14 | 0.0033 | |
| CCI20 | -181.1865 | Sell | Chaikin Money Flow | -0.2488 | Sell |
| MACD | -0.0018 | Sell | Money Flow Index | 27.6817 | Sell |
| ROC | -45.1087 | Sell | RSI | 36.4273 | Sell |
| STOCH (14,3) | 1.1111 | OverSold | STOCH RSI | 0.0000 | OverSold |
| UO | 33.5979 | Sell | Williams %R | -98.8889 | OverSold |


