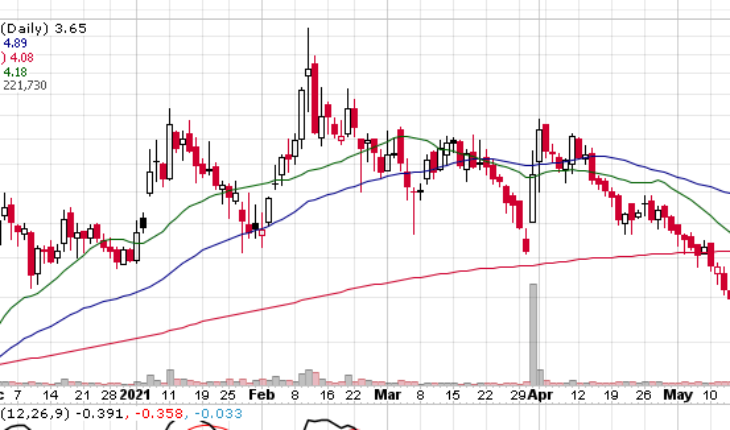
Greenlane Holdings Inc (NASDAQ:GNLN) is trading in a narrow range on Tuesday. The stock has made a small move off its lows the last few days. Today’s move stalled at yesterday’s high, which may tell us that GNLN is headed lower before any march higher.
Market Action
As of 11:56, GNLN stock is trading lower by 1.08% at $3.65. More than 235K shares have traded hands, compared to its 30-day average volume of 769K shares.
GNLN Issues News
Greenlane Accelerates Acquisition Strategy and Achieves Second Consecutive Quarter of Record Greenlane Brands Revenue in Q1 2021
- Net sales were $34.0 million in Q1 2021, compared to $33.9 million in Q1 2020, an increase of $0.1 million, or 0.4%.
- Gross profit was $7.3 million, or 21.5% of net sales in Q1 2021, compared to $7.3 million, or 21.6% of net sales in Q1 2020.
- Cash totaled $12.3 million as of March 31, 2021, a decrease from approximately $30.4 million as of December 31, 2020.
- Net sales for our United States reporting segment increased $1.5 million, or 5.7% in Q1 2021, to $28.7 million, compared to approximately $27.1 million in the same period in 2020. Net Sales for our Canadian reporting segment decreased to approximately $2.6 million for Q1 2021 compared to approximately $4.4 million in the same period in 2020, primarily due to a decrease of $1.6 million in non-core revenue sales as a result of the Company’s strategic shift away from low-margin nicotine sales.
Trader Notes
Share Information
| SHARES OUTSTANDING | 16.93 M |
| SHARE FLOAT (%) | 15.78 M (93.22%) |
| % HELD BY INSTITUTIONS | 40.58 |
Recent Stock Performance
| 5-DAY PERF. | -5.68% |
| 1-MONTH PERF. | -27.29% |
| 3-MONTH PERF. | -39.57% |
| 6-MONTH PERF. | +27.18% |
| YTD PERF. | -7.83% |
| 1-YEAR PERF. | +33.21% |
Moving Averages
| +/- EMA(20) | 4.14 (-11.84%) |
| +/- SMA(50) | 4.89 (-25.36%) |
| +/- SMA(200) | 4.08 (-10.54%) |
Pivot Points
| Name | S3 | S2 | S1 | Pivot Points | R1 | R2 | R3 |
| Classic | 3.2567 | 3.3833 | 3.5367 | 3.6633 | 3.8167 | 3.9433 | 4.0967 |
| Fibonacci | 3.3833 | 3.4903 | 3.5564 | 3.6633 | 3.7703 | 3.8364 | 3.9433 |
Technical Indicators
| Symbol | Value | Result | Symbol | Value | Result |
| ADX | 15.6380 | Neutral | ATR14 | 0.3808 | |
| CCI20 | -106.5607 | Sell | Chaikin Money Flow | 0.0169 | Neutral |
| MACD | -0.4131 | Sell | Money Flow Index | 16.5393 | OverSold |
| ROC | -19.7826 | Sell | RSI | 32.7254 | Buy |
| STOCH (14,3) | 24.3056 | Sell | STOCH RSI | 0.7834 | Buy |
| UO | 47.5216 | Sell | Williams %R | -75.6944 | Neutral |


