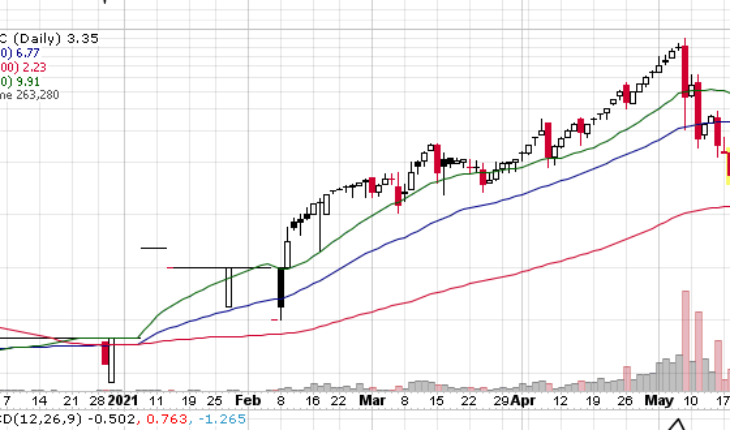
Sino United Worldwide Consolidated Ltd (OTCMKTS: SUIC) is one of the big OTC losers on Tuesday. The stock has been under much pressure this month. There may be some support here at 3.00, but we have to remember this run started at .50, so it could still get worse.
Market Action
As of 1:13, SUIC stock slumped 27% or $1.24 to $3.35. The stock has seen a total volume of 263K shares – 1.78X its average volume. The stock opened at $0.0085 and moved in a wide range of $0.0081 – 0.0122.
SUIC Issues News
SUIC Announces the Signing of an Addendum with Seiki Digital and Starts Negotiation of a $50-Million Revolving Credit Facility With Major Banks in Asia To Finance Walmart $70 Million Orders, Allowing Seiki to Generate More Orders and Guaranteed Continuous Financing
- SUIC has signed an Addendum to its Supply Chain Financing Agreement with Seiki Digital, and starts negotiation of a $50-Million revolving credit facility with major banks and financial institutions in Asia to finance Walmart $70 million orders.
- This will allow Seiki to generate more orders and guaranteed continuous financing and provide the means to fund growth for Seiki Digital.
- Seiki Digital a company that manufactures consumer electronic goods and smart appliances for U.S. distribution through Walmart, among others, will receive this loan financing facility intended to provide its subsidiaries all around the world with the funds necessary for the manufacturing and sales of its electronic products, through its overseas subsidiary.
- SUIC will continue to support the overseas business expansion of Seiki Digital by drawing on its and its partners’ various financial facilities and schemes for structuring economical financing programs for Seiki Digital.
Trader Notes
Share Information
| SHARES OUTSTANDING | 33.50 M |
| SHARE FLOAT (%) | 8.50 M (25.38%) |
| % HELD BY INSTITUTIONS | – |
Recent Stock Performance
| 5-DAY PERF. | -37.96% |
| 1-MONTH PERF. | -48.46% |
| 3-MONTH PERF. | +28.85% |
| 6-MONTH PERF. | +1096.43% |
| YTD PERF. | +737.71% |
| 1-YEAR PERF. | +980.65% |
Moving Averages
| +/- EMA(20) | 8.22 (-59.25%) |
| +/- SMA(50) | 6.77 (-50.52%) |
| +/- SMA(200) | 2.23 (+50.22%) |
Pivot Points
| Name | S3 | S2 | S1 | Pivot Points | R1 | R2 | R3 |
| Classic | 3.1967 | 3.8433 | 4.2167 | 4.8633 | 5.2367 | 5.8833 | 6.2567 |
| Fibonacci | 3.8433 | 4.2330 | 4.4737 | 4.8633 | 5.2530 | 5.4937 | 5.8833 |
Sino United Worldwide Consolidated Ltd (OTCMKTS: SUIC) is one of the biggest penny stock losers on Tuesday.
Market Action
As of 1:13, SUIC stock slumped 27% or $1.24 to $3.35. The stock has seen a total volume of 263K shares – 1.78X its average volume. The stock opened at $0.0085 and moved in a wide range of $0.0081 – 0.0122.
SUIC Issues News
SUIC Announces the Signing of an Addendum with Seiki Digital and Starts Negotiation of a $50-Million Revolving Credit Facility With Major Banks in Asia To Finance Walmart $70 Million Orders, Allowing Seiki to Generate More Orders and Guaranteed Continuous Financing
SUIC has signed an Addendum to its Supply Chain Financing Agreement with Seiki Digital, and starts negotiation of a $50-Million revolving credit facility with major banks and financial institutions in Asia to finance Walmart $70 million orders.
This will allow Seiki to generate more orders and guaranteed continuous financing and provide the means to fund growth for Seiki Digital.
Seiki Digital a company that manufactures consumer electronic goods and smart appliances for U.S. distribution through Walmart, among others, will receive this loan financing facility intended to provide its subsidiaries all around the world with the funds necessary for the manufacturing and sales of its electronic products, through its overseas subsidiary.
SUIC will continue to support the overseas business expansion of Seiki Digital by drawing on its and its partners’ various financial facilities and schemes for structuring economical financing programs for Seiki Digital.
Trader Notes
Share Information
| SHARES OUTSTANDING | 33.50 M |
| SHARE FLOAT (%) | 8.50 M (25.38%) |
| % HELD BY INSTITUTIONS | – |
Recent Stock Performance
| 5-DAY PERF. | -37.96% |
| 1-MONTH PERF. | -48.46% |
| 3-MONTH PERF. | +28.85% |
| 6-MONTH PERF. | +1096.43% |
| YTD PERF. | +737.71% |
| 1-YEAR PERF. | +980.65% |
Moving Averages
| +/- EMA(20) | 8.22 (-59.25%) |
| +/- SMA(50) | 6.77 (-50.52%) |
| +/- SMA(200) | 2.23 (+50.22%) |
Pivot Points
| Name | S3 | S2 | S1 | Pivot Points | R1 | R2 | R3 |
| Classic | 3.1967 | 3.8433 | 4.2167 | 4.8633 | 5.2367 | 5.8833 | 6.2567 |
| Fibonacci | 3.8433 | 4.2330 | 4.4737 | 4.8633 | 5.2530 | 5.4937 | 5.8833 |
Technical Indicators
| Symbol | Value | Result | Symbol | Value | Result |
| ADX | 18.3564 | Neutral | ATR14 | 2.4575 | |
| CCI20 | -123.1490 | Sell | Chaikin Money Flow | -0.0940 | Sell |
| MACD | 0.0959 | Buy | Money Flow Index | 50.8536 | Sell |
| ROC | -61.7500 | Sell | RSI | 40.3608 | Sell |
| STOCH (14,3) | 2.1587 | OverSold | STOCH RSI | 0.0000 | OverSold |
| UO | 31.9335 | Sell | Williams %R | -97.8413 | OverSold |


