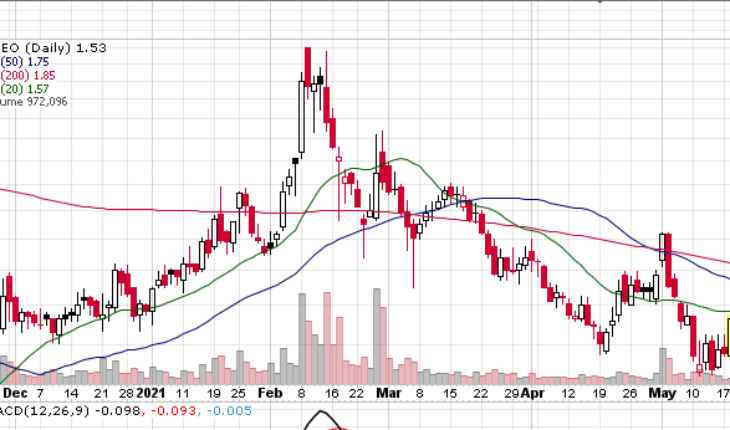
Abeona Therapeutics Inc (NASDAQ:ABEO) is in a nice uptrend on Tuesday and now trading at session’s high. After breaking the1.45 area there may be some clear sailing ahead. 1.75 may be the next stop.
Market Action
As of 12:06, ABEO stock surged 12.13 to $1.525. The stock has seen a total volume of 1.05 million shares. The stock opened at $1.35 and moved in a range of $1.3500 – 1.5400.
ABEO Issues Q1 Earnings
Abeona Therapeutics Reports First Quarter Financial Results
- Cash, cash equivalents and short-term investments totaled $86.8 million as of March 31, 2021, compared to $95.0 million as of December 31, 2020.
- Net loss was $16.0 million for the first quarter of 2021, compared to net loss of $48.2 million for the comparable period in 2020.
- Research and development (R&D) expenses were $7.2 million for the first quarter of 2021, compared to $6.8 million in the comparable period in 2020.
Trader Notes
Share Information
| SHARES OUTSTANDING | 99.04 M |
| SHARE FLOAT (%) | 85.99 M (86.83%) |
| % HELD BY INSTITUTIONS | 35.53 |
Recent Stock Performance
| 5-DAY PERF. | +16.79% |
| 1-MONTH PERF. | +2.68% |
| 3-MONTH PERF. | -37.80% |
| 6-MONTH PERF. | +9.29% |
| YTD PERF. | -2.55% |
| 1-YEAR PERF. | -49.17% |
Moving Averages
| +/- EMA(20) | 1.53 (+0.00%) |
| +/- SMA(50) | 1.75 (-12.57%) |
| +/- SMA(200) | 1.85 (-17.30%) |
Pivot Points
| Name | S3 | S2 | S1 | Pivot Points | R1 | R2 | R3 |
| Classic | 1.2233 | 1.2867 | 1.3233 | 1.3867 | 1.4233 | 1.4867 | 1.5233 |
| Fibonacci | 1.2867 | 1.3249 | 1.3485 | 1.3867 | 1.4249 | 1.4485 | 1.4867 |
Technical Indicators
| Symbol | Value | Result | Symbol | Value | Result |
| ADX | 19.6017 | Neutral | ATR14 | 0.1831 | |
| CCI20 | -83.5681 | Sell | Chaikin Money Flow | -0.0920 | Sell |
| MACD | -0.1536 | Sell | Money Flow Index | 46.3565 | Sell |
| ROC | -19.0476 | Sell | RSI | 42.2229 | Buy |
| STOCH (14,3) | 12.8205 | OverSold | STOCH RSI | 0.5851 | Buy |
| UO | 36.4328 | Sell | Williams %R | -87.1795 | OverSold |
