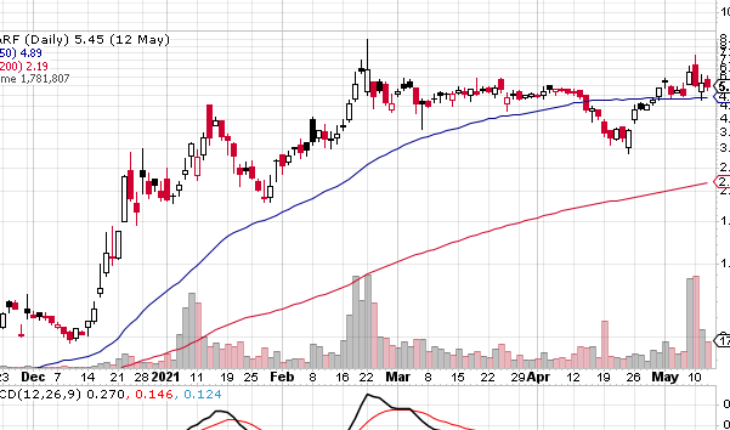
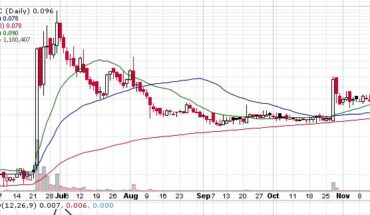
Bitfarms Ltd (OTCMKTS: BFARF) stock closed lower on Monday after four down sessions. The stock made a very impressive run over the last few weeks from 3.00 to over 7.00. Of course a pull back is normal as some traders will take profits off the table. BFARF needs an up day to get back on track.
Market Action
On Monday, BFARF fell 8.44% or $0.45 to end the session at $4.88. Total volume for the session stood at 2.81 million shares, above its average volume of 1.69 million. The stock opened at $5.1926 and moved within a narrow range of $4.7700-5.3257.
BFARF Issued News Late Monday,
Bitfarms Announces CAD$75.0 Million Private Placement with U.S. Institutional Investors
- BFARF announced it has entered into subscription agreements with certain institutional investors for gross proceeds of approximately CAD$75.0 million in a private placement in the United States, comprised of 14,150,944 common shares at CAD$5.30 per common share along with warrants to purchase an aggregate of up to 10,613,208 common shares.
- The warrants have an exercise price of USD$4.87 per common share and exercise period of three years.
- The net proceeds of the private placement will be used by the Company mainly to acquire additional miners, expand infrastructure, and improve its working capital position, in support of its plans to more than triple its hashrate in 2021 to 3.0 EH/s, then grow to 8.0 EH/s in 2022.
- The private placement is expected to close on or about May 20, 2021, subject to satisfaction of customary closing conditions and approval of the TSX Venture Exchange.
Trader Notes
Recent Stock Performance
| 5-DAY PERF. | +3.22% |
| 1-MONTH PERF. | +6.45% |
| 3-MONTH PERF. | +56.95% |
| 6-MONTH PERF. | +1166.85% |
| YTD PERF. | +186.84% |
| 1-YEAR PERF. | +1413.47% |
Moving Averages
| +/- EMA(20) | 5.15 (+5.83%) |
| +/- SMA(50) | 4.93 (+10.55%) |
| +/- SMA(200) | 2.27 (+140.09%) |
Pivot Points
| Name | S3 | S2 | S1 | Pivot Points | R1 | R2 | R3 |
| Classic | 4.1024 | 4.4362 | 4.6581 | 4.9919 | 5.2138 | 5.5476 | 5.7695 |
| Fibonacci | 4.4362 | 4.6485 | 4.7796 | 4.9919 | 5.2042 | 5.3353 | 5.5476 |
Technical Indicators
| Symbol | Value | Result | Symbol | Value | Result |
| ADX | 44.0124 | Buy | ATR14 | 0.8016 | |
| CCI20 | 14.3035 | Neutral | Chaikin Money Flow | -0.1498 | Sell |
| MACD | 0.2626 | Buy | Money Flow Index | 46.2992 | Sell |
| ROC | 2.3726 | Buy | RSI | 49.4989 | Sell |
| STOCH (14,3) | 17.8085 | OverSold | STOCH RSI | 0.0000 | OverSold |
| UO | 43.1972 | Sell | Williams %R | -82.1915 | OverSold |
