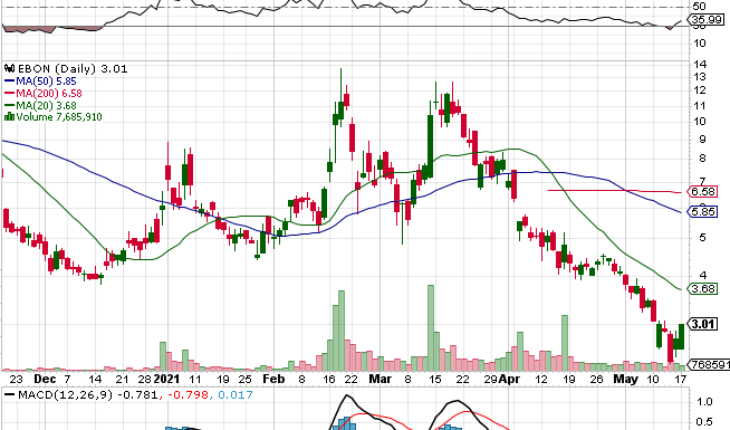
Ebang International Holdings Inc (NASDAQ:EBON) is up in the pre-market trading session.
Market Action
EBON is currently trading at 3.07 up 1.99% or $ 0.06 Yesterday 7 million shares have traded, much below its 30-day average volume of 18.88 million shares. The stock closed at $3.01 and moved within a range of $2.59 – $3.01.
EBON Misleading Claims
Ebang International Holdings Inc is accused of making materially false and misleading statements regarding the company’s business.
- EBON sales were declining but the statements show an increase in sales
- The company used the public offerings to buy low yields long-term bonds to an underwriter rather than to develop the company’s operations.
- EBON’s share price fell $0.12 (2.17%) and is at $5.41 per share on April 7, 2021, and fell further to $5.03 per share on April 8, 2021.
Trader Notes
Share Information
| SHARES OUTSTANDING | 185.84 M |
| SHARE FLOAT (%) | 129.34 M (69.60%) |
| % HELD BY INSTITUTIONS | 5.80 |
Recent Stock Performance
| 5-DAY PERF. | -1.95% |
| 1-MONTH PERF. | -37.55% |
| 3-MONTH PERF. | -71.28% |
| 6-MONTH PERF. | -60.03% |
| YTD PERF. | -50.41% |
| 1-YEAR PERF. | – |
Moving Averages
| +/- EMA(20) | 3.71 (-18.87%) |
| +/- SMA(50) | 5.85 (-48.55%) |
| +/- SMA(200) | 6.58 (-54.26%) |
Pivot Points
| Name | S3 | S2 | S1 | Pivot Points | R1 | R2 | R3 |
| Classic | 2.3100 | 2.4500 | 2.7300 | 2.8700 | 3.1500 | 3.2900 | 3.5700 |
| Fibonacci | 2.4500 | 2.6104 | 2.7096 | 2.8700 | 3.0304 | 3.1296 | 3.2900 |
Technical Indicators
| Symbol | Value | Result | Symbol | Value | Result |
| ADX | 42.0577 | Sell | ATR14 | 0.4405 | |
| CCI20 | -98.9547 | Sell | Chaikin Money Flow | 0.0421 | Neutral |
| MACD | -0.9395 | Sell | Money Flow Index | 23.2909 | Sell |
| ROC | -27.1186 | Sell | RSI | 36.2681 | Buy |
| STOCH (14,3) | 30.7692 | Buy | STOCH RSI | 1.0000 | OverBought |
| UO | 48.6391 | Buy | Williams %R | -69.2308 | Neutral |


