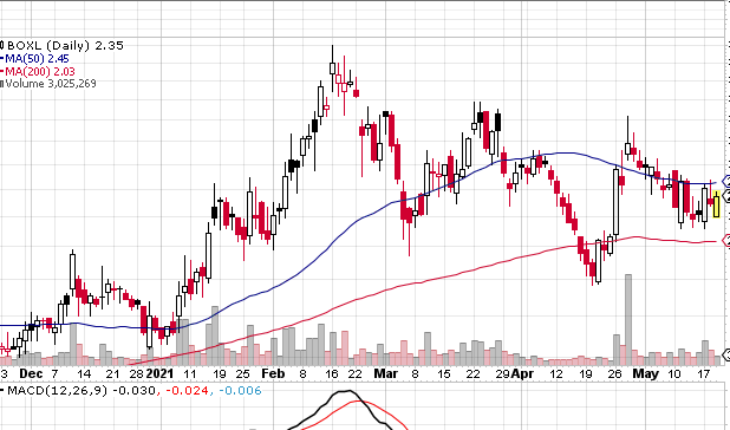
Boxlight Corp (NASDAQ:BOXL) continues to recover gradually on Wednesday.
Market Action
As of 11:29, BOXL stock has moved up over 3% or $0.07 to $2.36. total traded volume was 3.48 million shares, compared to its average volume of 4.40 million shares. The stock has moved in range of $ 2.2000 – 2.3800 after opening at $2.20.
BOXL Released News Last Week
Boxlight Reports First Quarter 2021 Financial Results
- Revenues for the three months ended March 31, 2021 were $33.4 million as compared to $5.7 million for the three months ended March 31, 2020, resulting in a 484% increase due primarily to the acquisition of Sahara in September 2020.
- Gross profit for the three months ended March 31, 2021 was $8.6 million as compared to $1.6 million for the three months ended March 31, 2020.
- The Company reported a net loss of $(5.2) million for the three months ended March 31, 2021 as compared to a net loss of $(2.0) million for the three months ended March 31, 2020.
- The net loss attributable to common shareholders was $(5.5) million and $(2.0) million for the three months ended March 31, 2021 and 2020, respectively, after deducting fixed dividends to Series B preferred shareholders.
- The EPS loss for the three months ended March 31, 2021 was $(0.09) per basic and diluted share, compared to $(0.16) per basic and diluted share for the three months ended March 31, 2020.
Trader Notes
Share Information
| SHARES OUTSTANDING | 56.79 M |
| SHARE FLOAT (%) | 47.09 M (82.92%) |
| % HELD BY INSTITUTIONS | 8.65 |
Recent Stock Performance
| 5-DAY PERF. | +5.38% |
| 1-MONTH PERF. | +24.34% |
| 3-MONTH PERF. | -30.68% |
| 6-MONTH PERF. | +58.78% |
| YTD PERF. | +53.59% |
| 1-YEAR PERF. | +198.56% |
Moving Averages
| +/- EMA(20) | 2.36 (-0.42%) |
| +/- SMA(50) | 2.45 (-4.08%) |
| +/- SMA(200) | 2.03 (+15.76%) |
Pivot Points
| Name | S3 | S2 | S1 | Pivot Points | R1 | R2 | R3 |
| Classic | 2.0333 | 2.1567 | 2.2233 | 2.3467 | 2.4133 | 2.5367 | 2.6033 |
| Fibonacci | 2.1567 | 2.2292 | 2.2741 | 2.3467 | 2.4192 | 2.4641 | 2.5367 |
Technical Indicators
| Symbol | Value | Result | Symbol | Value | Result |
| ADX | 30.0928 | Sell | ATR14 | 0.2551 | |
| CCI20 | -14.5609 | Neutral | Chaikin Money Flow | -0.0776 | Sell |
| MACD | -0.0306 | Sell | Money Flow Index | 43.7861 | Sell |
| ROC | -11.2403 | Sell | RSI | 46.4146 | Buy |
| STOCH (14,3) | 22.6667 | Sell | STOCH RSI | 0.5404 | Neutral |
| UO | 42.4149 | Sell | Williams %R | -77.3333 | Neutral |


