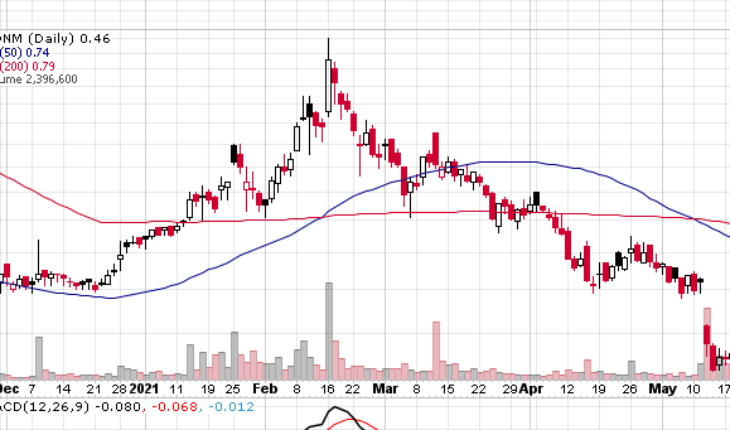
Sonim Technologies Inc (NASDAQ:SONM) is consolidating near its 52-week low. Could it bounce? The last time SONM was in this area last November, it made a huge move up. Looking back to last March, the stock also rallied from this area.
Market Action
On Tuesday, SONM stock gained by 0.0093 or 2.07% to close at $0.4588. Total volume was 2.35 million shares, above its average volume of 1.85 million shares. The stock moved in a range of $0.4440 – 0.4694 after opening at $0.45.
SONM’s Recent News
May 11, 2021, – Sonim Reports First Quarter Results and Accelerating New Product Orders
- Net revenues of $12.2 million, compared with $12.7 million in the first quarter 2020.
- Gross profit increased 14% year-over-year, and gross margin increased from the first quarter of 2020 to 20.1%.
- GAAP net loss was $9.3 million, or $0.14 per share.
- Ended the quarter with cash and cash equivalents of $13.9 million.
- Expansion into the rugged handheld and tablet computer with integrated barcode scanners enables Sonim to enter a new $2 billion worldwide TAM and open sales opportunities in non-US markets.
- Announced further growth of Sonim’s distribution platform, including SYNNEX in North America and Syndico in the United Kingdom as Sonim continues to expand its addressable market opportunities.
Trader Notes
Share Information
| SHARES OUTSTANDING | 66.32 M |
| SHARE FLOAT (%) | 52.46 M (79.11%) |
| % HELD BY INSTITUTIONS | 40.05 |
Recent Stock Performance
| 5-DAY PERF. | -26.00% |
| 1-MONTH PERF. | -24.81% |
| 3-MONTH PERF. | -64.71% |
| 6-MONTH PERF. | -21.49% |
| YTD PERF. | -36.63% |
| 1-YEAR PERF. | -46.02% |
Moving Averages
| +/- EMA(20) | 0.58 (-20.69%) |
| +/- SMA(50) | 0.74 (-37.84%) |
| +/- SMA(200) | 0.79 (-41.77%) |
Pivot Points
| Name | S3 | S2 | S1 | Pivot Points | R1 | R2 | R3 |
| Classic | 0.3654 | 0.3858 | 0.4015 | 0.4219 | 0.4376 | 0.4580 | 0.4737 |
| Fibonacci | 0.3858 | 0.3996 | 0.4081 | 0.4219 | 0.4357 | 0.4442 | 0.4580 |
Technical Indicators
| Symbol | Value | Result | Symbol | Value | Result |
| ADX | 51.1028 | Buy | ATR14 | 0.0996 | |
| CCI20 | -75.5665 | Sell | Chaikin Money Flow | 0.1241 | Buy |
| MACD | 0.0393 | Buy | Money Flow Index | 9.5298 | OverSold |
| ROC | -42.1060 | Sell | RSI | 47.2329 | Sell |
| STOCH (14,3) | 2.9304 | OverSold | STOCH RSI | 0.0000 | OverSold |
| UO | 27.5769 | OverSold | Williams %R | -97.0696 | OverSold |


