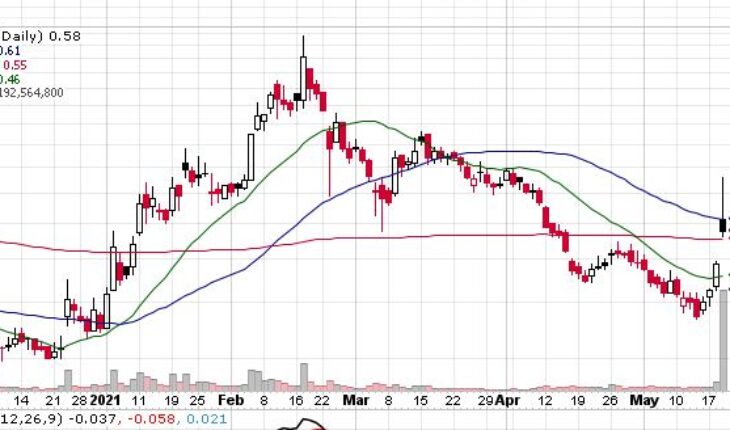
Advaxis Inc. (NASDAQ:ADXS) continues to move higher in the pre-market session on Thursday.
Market Action
As of 9:03, ADXS stock is trading higher by 4.55% to $0.60 in the pre-market session with more than 3.61 million shares have traded hands.
ADXS Announced News Late Wednesday
Advaxis Presents Updated Clinical Data from Ongoing Phase 1/2 Trial of ADXS-503 in NSCLC at the American Society of Clinical Oncology (ASCO) 2021 Annual Meeting
- ADXS announced updated data from the Company’s ongoing Phase 1/2 study evaluating ADXS-503 in combination with KEYTRUDA® which will be presented as a poster at the American Society of Clinical Oncology (ASCO) 2021 Annual Meeting.
- ADXS-503 is the first drug construct from the ADXS-HOT off-the-shelf, cancer-type specific, immunotherapy program which leverages Advaxis’ proprietary Lm technology platform to target hotspot mutations that commonly occur in specific cancer types as well as other proprietary, tumor-associated antigens.
“These early results, which include a disease control rate of 44% in the first 9 evaluable patients treated with ADXS-503 as an add on therapy at progression with pembrolizumab, are particularly encouraging given the durable nature of disease control in 3 patients,” said Suresh Ramalingam, M.D., Roberto C. Goizueta Chair for Cancer Research, Director, Division of Medical Oncology and Deputy Director of the Winship Cancer Institute at Emory University School of Medicine.
Trader Notes
Share Information
| SHARES OUTSTANDING | 137.96 M |
| SHARE FLOAT (%) | 133.29 M (96.62%) |
| % HELD BY INSTITUTIONS | 7.51 |
Recent Stock Performance
| 5-DAY PERF. | +44.46% |
| 1-MONTH PERF. | +24.52% |
| 3-MONTH PERF. | -50.79% |
| 6-MONTH PERF. | +48.52% |
| YTD PERF. | +65.13% |
| 1-YEAR PERF. | -20.06% |
Moving Averages
| +/- EMA(20) | 0.48 (+20.83%) |
| +/- SMA(50) | 0.61 (-4.92%) |
| +/- SMA(200) | 0.55 (+5.45%) |
Pivot Points
| Name | S3 | S2 | S1 | Pivot Points | R1 | R2 | R3 |
| Classic | 0.3059 | 0.4335 | 0.5046 | 0.6322 | 0.7033 | 0.8309 | 0.9020 |
| Fibonacci | 0.4335 | 0.5094 | 0.5563 | 0.6322 | 0.7081 | 0.7550 | 0.8309 |
Technical Indicators
| Symbol | Value | Result | Symbol | Value | Result |
| ADX | 33.1743 | Buy | ATR14 | 0.0718 | |
| CCI20 | 247.7065 | OverBought | Chaikin Money Flow | -0.5488 | Sell |
| MACD | -0.0454 | Sell | Money Flow Index | 85.1316 | OverBought |
| ROC | 21.4768 | Buy | RSI | 59.7702 | Buy |
| STOCH (14,3) | 53.1942 | Buy | STOCH RSI | 1.0000 | OverBought |
| UO | 43.2362 | Buy | Williams %R | -46.8058 | Neutral |


