Iqstel Inc (OTCMKTS:IQST) stock ended with a mild losses on Thursday after the news.
Market Action
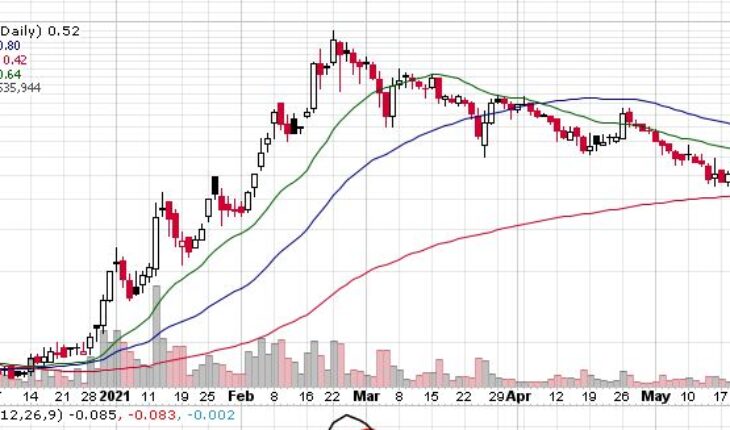
IQST stock ended Thursday at $0.52, almost unchanged. More than 535K shares traded hands, below its 30-day average of 2.25 million shares. The stock opened at $0.5399 and moved within a range of $0.5000 – 0.5399.
IQST Released News
IQST – iQSTEL Grows 16% In April To $5.28 Million In Revenue Toward $60.5 Million Annual Forecast
- IQST reported the company reached $5.28 Million in revenue for the month of April (preliminary unaudited figure). The April revenue represents a 16% increase over the revenue achieved in March.
- “All our operating subsidiaries are working in concert within our collective business plan toward our $60.4 Million revenue forecast,” said Leandro Iglesias, iQSTEL CEO. “I reiterate what I said in our recent letter to shareholders following the close of Q1: ‘Of course, we still have room to improve, and every day the management team keeps focusing on increasing the company business value, reducing costs, reducing expenses, increasing profit, and increasing revenues, all at the same time.'”
- iQSTEL reported 182% revenue growth in Q1-FY2021 keeping the company well on track to its $60.5 Million Annual Revenue Forecast.
Trader Notes
Share Information
| SHARES OUTSTANDING | 136.88 M |
| SHARE FLOAT (%) | 129.75 M (94.79%) |
| % HELD BY INSTITUTIONS | 0.01 |
Recent Stock Performance
| 5-DAY PERF. | +8.33% |
| 1-MONTH PERF. | -23.53% |
| 3-MONTH PERF. | -63.86% |
| 6-MONTH PERF. | +511.76% |
| YTD PERF. | +160.39% |
| 1-YEAR PERF. | +773.95% |
Moving Averages
| +/- EMA(20) | 0.61 (-14.75%) |
| +/- SMA(50) | 0.80 (-35.00%) |
| +/- SMA(200) | 0.42 (+23.81%) |
Pivot Points
| Name | S3 | S2 | S1 | Pivot Points | R1 | R2 | R3 |
| Classic | 0.4601 | 0.4801 | 0.5000 | 0.5200 | 0.5399 | 0.5599 | 0.5798 |
| Fibonacci | 0.4801 | 0.4953 | 0.5047 | 0.5200 | 0.5352 | 0.5446 | 0.5599 |
Technical Indicators
| Symbol | Value | Result | Symbol | Value | Result |
| ADX | 37.1158 | Buy | ATR14 | 0.1011 | |
| CCI20 | -76.4872 | Sell | Chaikin Money Flow | -0.1889 | Sell |
| MACD | -0.0930 | Sell | Money Flow Index | 27.9420 | Sell |
| ROC | -22.3881 | Sell | RSI | 43.0251 | Buy |
| STOCH (14,3) | 21.2121 | Buy | STOCH RSI | 0.8206 | OverBought |
| UO | 40.3272 | Buy | Williams %R | -78.7879 | Neutral |


