Farmmi Inc (NASDAQ:FAMI) is gaining momentum in early trading session on Friday.
Market Action
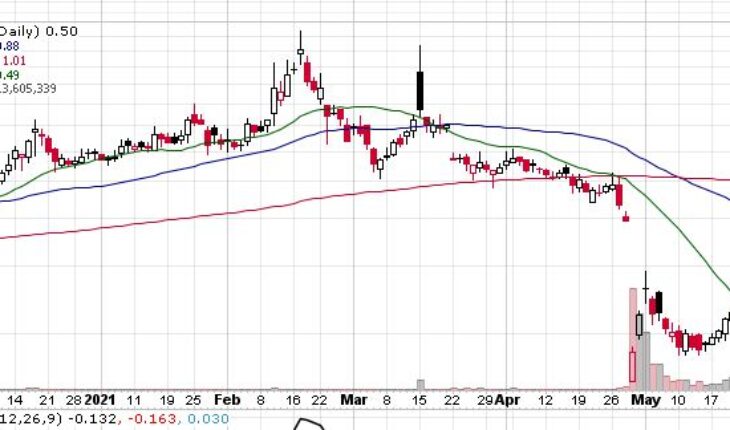
At the opening session, FAMI stock has moved up 6.48% at $0.4826. Total volume was 16.45 million shares have traded hands, compared to its average volume of 22.85 million shares. The stock has moved in a range of $0.4660 – 0.4890 after opening at $0.4745.
FAMI Releases News
Farmmi to Develop Agricultural Supply Chain; Aims to Become a Comprehensive Agricultural Industry Service Provider
- announced the establishment of Zhejiang Farmmi Agricultural Supply Chain Co., Ltd. Leveraging more than two decades of experience in China’s agriculture industry, Farmmi plans to build on its core business of high quality agricultural products to grow into a comprehensive service provider for the agricultural industry chain.
- The Company plans to invest in companies with storage facilities which could extend the Company’s logistics network. At present, the penetration rate of the digital economy in agriculture in China is estimated to be only 8%, compared with 36% for industries in China as a whole.
- The number of rural internet users exceeded 300 million, while number of agricultural products sold via internet or supply chain is still small. Compared with other industries, the digitization of agriculture in China still lags behind.
Ms. Yefang Zhang, Farmmi’s Chairwoman and CEO, said, “As China’s economy has grown, the country’s agriculture industry has also continued to improve. Nevertheless, the industry still faces legacy inefficiencies such as transportation delays that lead to food waste, lagging information about customer needs that result in poor demand predictions and small profit margins in an industry that continues to rely heavily on labor.”
Trader Notes
Share Information
| SHARES OUTSTANDING | 189.55 M |
| SHARE FLOAT (%) | 177.28 M (93.52%) |
| % HELD BY INSTITUTIONS | 9.08 |
Recent Stock Performance
| 5-DAY PERF. | +29.71% |
| 1-MONTH PERF. | -48.85% |
| 3-MONTH PERF. | -72.29% |
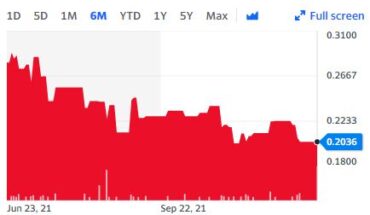
| 6-MONTH PERF. | -43.29% |
| YTD PERF. | -59.58% |
| 1-YEAR PERF. | -7.37% |
Moving Averages
| +/- EMA(20) | 0.53 (-7.55%) |
| +/- SMA(50) | 0.88 (-44.32%) |
| +/- SMA(200) | 1.01 (-51.49%) |
Pivot Points
| Name | S3 | S2 | S1 | Pivot Points | R1 | R2 | R3 |
| Classic | 0.3671 | 0.3848 | 0.4191 | 0.4368 | 0.4711 | 0.4888 | 0.5231 |
| Fibonacci | 0.3848 | 0.4047 | 0.4169 | 0.4368 | 0.4567 | 0.4689 | 0.4888 |
Technical Indicators
| Symbol | Value | Result | Symbol | Value | Result |
| ADX | 25.6457 | Sell | ATR14 | 0.0861 | |
| CCI20 | -30.7726 | Neutral | Chaikin Money Flow | 0.2782 | Buy |
| MACD | -0.1667 | Sell | Money Flow Index | 67.6979 | Buy |
| ROC | 0.3097 | Buy | RSI | 37.6354 | Buy |
| STOCH (14,3) | 44.9565 | Buy | STOCH RSI | 1.0000 | OverBought |
| UO | 57.3625 | Buy | Williams %R | -55.0435 | Neutral |


