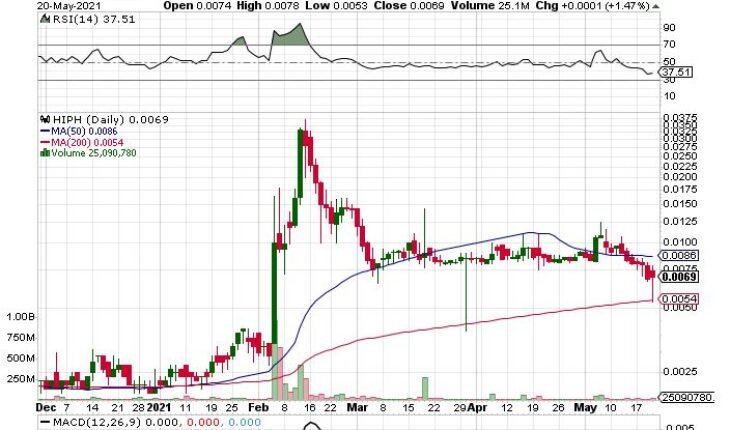
American Premium Water Corporation (OTCMKTS:HIPH) is on a descending trend line. Will it be able to bounce back?
Market Action
On Thursday, HIPH stock closed at $0.0069 gained 1.47% to $0.0001. The stock has a total volume of almost 25 million shares compared to its average volume 21.64 million. The stock has moved in a range of $0.0053 – $0.0078 after opening at $0.0074.
HIPH Business Description
American Premium Water Corporation is a diversified luxury consumer company based in Delray Beach, Florida. Its products focus on health, beauty, and biotech sectors. The company was formerly known as Expert Groups Inc., and it changed its name into American Premium Water Corporation in 2013.
HIPH Latest Developments
American Premium Water Corporation (OTCMKTS:HIPH) to sponsor a volleyball tournament.
- HIPH and its joint venture partner CaliBear will be sponsoring AVPNext Gold Series Titan Performance & Coconut Beach Open.
- The tournament is set to take place in New Orleans on June 5th -6th. CaliBear looks to launch official CaliBear products, which will also be available for preview.
Ryan Fishoff, CEO of American Premium Water, commented, “The Company is excited that our JV partner will be sponsoring the AVP Titan Performance & Coconut Beach Men’s and Women’s & Juniors Event. This is the first AVPNext Gold Series tournament since the pandemic. There is a lot of anticipation for this event; it will be well attended and provide a great opportunity for our target demographic to learn more about CaliBear and preview some of the great products the Company is developing. Attendees at the Coconut Beach Open are the embodiment of CaliBear’s “Performance Lifestyle.”
Trader Notes
Share Information
| SHARES OUTSTANDING | 556.19 M |
| SHARE FLOAT (%) | 556.19 M (100.00%) |
| % HELD BY INSTITUTIONS | – |
Recent Stock Performance
| 5-DAY PERF. | -16.87% |
| 1-MONTH PERF. | -20.69% |
| 3-MONTH PERF. | -52.41% |
| 6-MONTH PERF. | +228.57% |
| YTD PERF. | +228.57% |
| 1-YEAR PERF. | +475.00% |
Moving Averages
| +/- EMA(20) | 0.0084 (-17.86%) |
| +/- SMA(50) | 0.0047 (+46.81%) |
| +/- SMA(200) | 0.0059 (+16.95%) |
Pivot Points
| Name | S3 | S2 | S1 | Pivot Points | R1 | R2 | R3 |
| Classic | 0.0029 | 0.0041 | 0.0055 | 0.0067 | 0.0081 | 0.0093 | 0.0107 |
| Fibonacci | 0.0041 | 0.0051 | 0.0057 | 0.0067 | 0.0077 | 0.0083 | 0.0093 |
Technical Indicators
| Symbol | Value | Result | Symbol | Value | Result |
| ADX | 24.4998 | Neutral | ATR14 | 0.0017 | |
| CCI20 | -185.5086 | Sell | Chaikin Money Flow | -0.1457 | Sell |
| MACD | -0.0006 | Sell | Money Flow Index | 53.8808 | Sell |
| ROC | -16.8675 | Sell | RSI | 38.9381 | Sell |
| STOCH (14,3) | 22.2222 | Sell | STOCH RSI | 0.0731 | OverSold |
| UO | 34.7631 | Sell | Williams %R | -77.7778 | Neutral |
