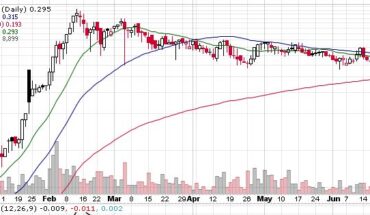
Vinco Ventures Inc (NASDAQ:BBIG) stock ended higher on Friday. Will the momentum continue next week?
Market Action
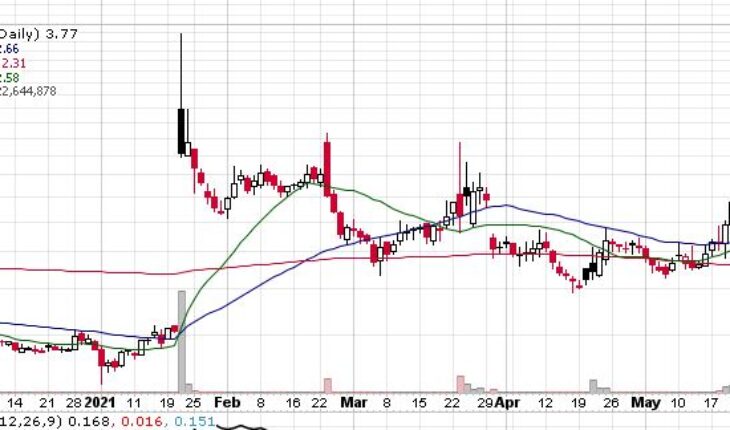
BBIG stock was up $0.40 or 11.87% to close at $3.77 on Friday. The stock made a high and low of $4.07 and $3.08 respectively for the session after opening at $3.39. The total volume for the day was 22.64 million shares – 6X is average volume of 4.03 million shares.
BBIG Released News This Week
May 19, 2021 – Vinco Ventures, Inc. Announces Exclusive NFT Album by Mega Hit Artist Tory Lanez
- announced that its subsidiary, Emmersive Entertainment, is set to release an exclusive NFT from superstar rapper, singer, songwriter and record producer Tory Lanez.
- Tory, who is known for his out of the box creativity, is working in conjunction with Emmersive Entertainment on a creative campaign that is poised to make history with his new album of original songs and accompanying artwork.
- Being a pioneer in the NFT space, Tory has developed his career as a creative disruptor. Tory’s NFT album will be available exclusively on the upcoming Emmersive Entertainment platform.
David J. Kovacs, Co-Founder of Emmersive Entertainment, as well as Co-Founder of First Contact Entertainment, a leading virtual reality video game company that includes Call of Duty veterans, added, “Tory’s transcendental forward thinking, and laser focused vision was a perfect synergy for us. There are very few people on Earth with his gift. When you combine that talent and vision with the marketing power that Vinco can access through Lomotif, it’s a clear winner. With 10’s of millions of active users we can market our proprietary E-NFT’s to a targeted audience not only nationwide but worldwide as well.”
Trader Notes
Share Information
| SHARES OUTSTANDING | 27.43 M |
| SHARE FLOAT (%) | 19.35 M (70.52%) |
| % HELD BY INSTITUTIONS | 7.40 |
Recent Stock Performance
| 5-DAY PERF. | +52.63% |
| 1-MONTH PERF. | +69.82% |
| 3-MONTH PERF. | -3.83% |
| 6-MONTH PERF. | +158.22% |
| YTD PERF. | +175.18% |
| 1-YEAR PERF. | +65.35% |
Moving Averages
| +/- EMA(20) | 2.70 (+39.63%) |
| +/- SMA(50) | 2.66 (+41.73%) |
| +/- SMA(200) | 2.31 (+63.20%) |
Pivot Points
| Name | S3 | S2 | S1 | Pivot Points | R1 | R2 | R3 |
| Classic | 2.2200 | 2.6500 | 3.2100 | 3.6400 | 4.2000 | 4.6300 | 5.1900 |
| Fibonacci | 2.6500 | 3.0282 | 3.2618 | 3.6400 | 4.0182 | 4.2518 | 4.6300 |
Technical Indicators
| Symbol | Value | Result | Symbol | Value | Result |
| ADX | 39.5913 | Buy | ATR14 | 0.3569 | |
| CCI20 | 331.6888 | OverBought | Chaikin Money Flow | 0.4214 | Buy |
| MACD | 0.1457 | Buy | Money Flow Index | 94.6910 | OverBought |
| ROC | 69.0583 | Buy | RSI | 77.9030 | OverBought |
| STOCH (14,3) | 84.5361 | OverBought | STOCH RSI | 1.0000 | OverBought |
| UO | 67.3326 | Buy | Williams %R | -15.4639 | OverBought |
