Farmmi Inc (NASDAQ:FAMI) is moving lower after opening with a slight gain.
Market Action
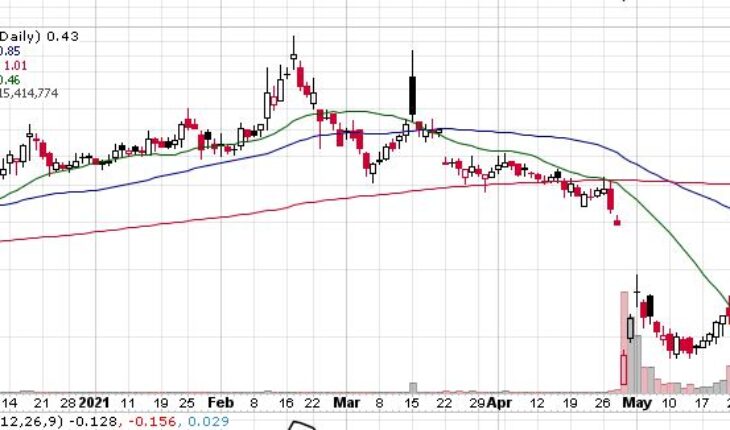
As of 10:57, FAMI stock went lower 4% to $0.43. The stock has traded 16.53 million shares, compared to its average volume of 24.72 million shares. After opening at $0.46, the stock has moved within a wide range of $0.4300 – 0.4640.
FAMI Releases News Today
Farmmi Continues Sales Push at Asia’s Largest Food Innovation Exhibition
- fami announced the Company showcased its expanded product line and global brand at Asia’s largest food innovation exhibition, the 2021 China International Food and Beverage Exhibition (the “2021 SIAL China”) in Shanghai from May 18-22, 2021.
- Founded in 2000, SIAL China (www.sialchina.cn) is co-hosted annually by the China Commerce Development Centre and the Comexposium Group. The 2021 SIAL China was held at the Shanghai New International Expo Center.
Ms. Yefang Zhang, Chairman and CEO of the company, said, “This was another highly successful event for Farmmi, which took on added significance as we were able to meet face-to-face with many valued partners and potential new partners. We continue to build sales momentum for our high-quality agriculture products, while also benefitting from very positive buzz following the recent announcement on our strategy to grow into a more comprehensive service provider.
Trader Notes
Share Information
| SHARES OUTSTANDING | 189.55 M |
| SHARE FLOAT (%) | 177.28 M (93.52%) |
| % HELD BY INSTITUTIONS | 9.08 |
Recent Stock Performance
| 5-DAY PERF. | +11.83% |
| 1-MONTH PERF. | -55.38% |
| 3-MONTH PERF. | -71.19% |
| 6-MONTH PERF. | -53.72% |
| YTD PERF. | -63.75% |
| 1-YEAR PERF. | -11.59% |
Moving Averages
| +/- EMA(20) | 0.52 (-15.38%) |
| +/- SMA(50) | 0.85 (-48.24%) |
| +/- SMA(200) | 1.01 (-56.44%) |
Pivot Points
| Name | S3 | S2 | S1 | Pivot Points | R1 | R2 | R3 |
| Classic | 0.3392 | 0.3861 | 0.4195 | 0.4664 | 0.4998 | 0.5467 | 0.5801 |
| Fibonacci | 0.3861 | 0.4168 | 0.4357 | 0.4664 | 0.4971 | 0.5160 | 0.5467 |
Technical Indicators
| Symbol | Value | Result | Symbol | Value | Result |
| ADX | 25.4056 | Sell | ATR14 | 0.0857 | |
| CCI20 | -11.0244 | Neutral | Chaikin Money Flow | 0.2266 | Buy |
| MACD | -0.1541 | Sell | Money Flow Index | 60.2843 | Buy |
| ROC | -0.2423 | Sell | RSI | 37.6049 | Buy |
| STOCH (14,3) | 62.3636 | Buy | STOCH RSI | 0.9964 | OverBought |
| UO | 53.1267 | Buy | Williams %R | -37.6364 | Neutral |


