Verastem Inc (NASDAQ:VSTM) is trading higher in the pre-market session on Monday after the news.
Market Action
As of 8:05, VSTM stock is trading higher by 5.52% to $1.91 in the pre-market session with more than 690K shares have traded hands.
VSTM Releases News Today
Verastem Oncology Receives Breakthrough Therapy Designation for VS-6766 with Defactinib in Recurrent Low-Grade Serous Ovarian Cancer
- VSTM today announced that the U.S. Food and Drug Administration (FDA) granted Breakthrough Therapy designation for the combination of its investigational RAF/MEK inhibitor VS-6766, with defactinib, its FAK inhibitor, for the treatment of all patients with recurrent low-grade serous ovarian cancer (LGSOC) regardless of KRAS status after one or more prior lines of therapy, including platinum-based chemotherapy.
- The combination of VS-6766 with defactinib is being evaluated in the ongoing investigator-initiated Phase 1/2 FRAME trial. In the most recent read-out from the FRAME LGSOC cohort (n=24), the overall response rate (ORR) is 52% (11 of 21 response evaluable patients), with KRAS mutant ORR at 70% (7 of 10 response evaluable patients), KRAS wild-type ORR at 44% (4 of 9 response evaluable patients) and KRAS status undetermined ORR at 0% (0 of 2 response evaluable patients).
- The most common side effects seen in the study were rash, creatine kinase elevation, nausea, hyperbilirubinemia and diarrhea, most being NCI CTC Grade 1/2 and all were reversible. Several patients have been on therapy for more than one year, indicating the potential for a long duration of benefit.
Trader Notes
Share Information
| SHARES OUTSTANDING | 171.92 M |
| SHARE FLOAT (%) | 169.29 M (98.47%) |
| % HELD BY INSTITUTIONS | 60.24 |
Recent Stock Performance
| 5-DAY PERF. | +8.50% |
| 1-MONTH PERF. | +13.12% |
| 3-MONTH PERF. | +13.93% |
| 6-MONTH PERF. | +115.54% |
| YTD PERF. | +49.77% |
| 1-YEAR PERF. | +64.43% |
Moving Averages
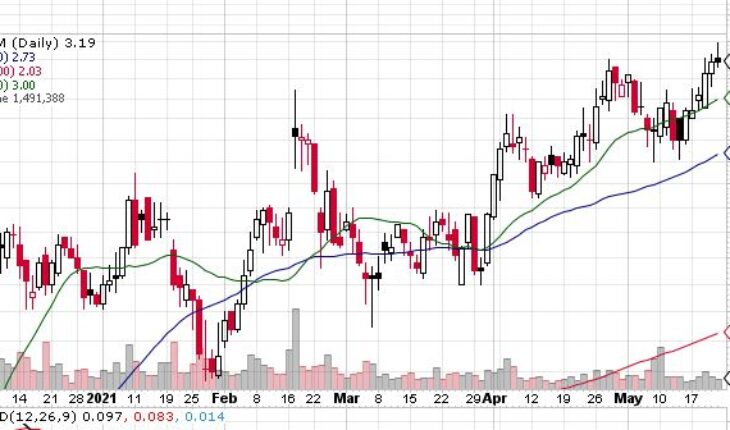
| +/- EMA(20) | 2.97 (+7.41%) |
| +/- SMA(50) | 2.73 (+16.85%) |
| +/- SMA(200) | 2.03 (+57.14%) |
Pivot Points
| Name | S3 | S2 | S1 | Pivot Points | R1 | R2 | R3 |
| Classic | 3.0067 | 3.0833 | 3.1367 | 3.2133 | 3.2667 | 3.3433 | 3.3967 |
| Fibonacci | 3.0833 | 3.1330 | 3.1637 | 3.2133 | 3.2630 | 3.2937 | 3.3433 |
Technical Indicators
| Symbol | Value | Result | Symbol | Value | Result |
| ADX | 11.4238 | Neutral | ATR14 | 0.1753 | |
| CCI20 | 161.1150 | Buy | Chaikin Money Flow | 0.2798 | Buy |
| MACD | 0.1107 | Buy | Money Flow Index | 61.4093 | Buy |
| ROC | 7.7703 | Buy | RSI | 63.6722 | Buy |
| STOCH (14,3) | 83.0508 | OverBought | STOCH RSI | 1.0000 | OverBought |
| UO | 57.6511 | Buy | Williams %R | -16.9492 | OverBought |


