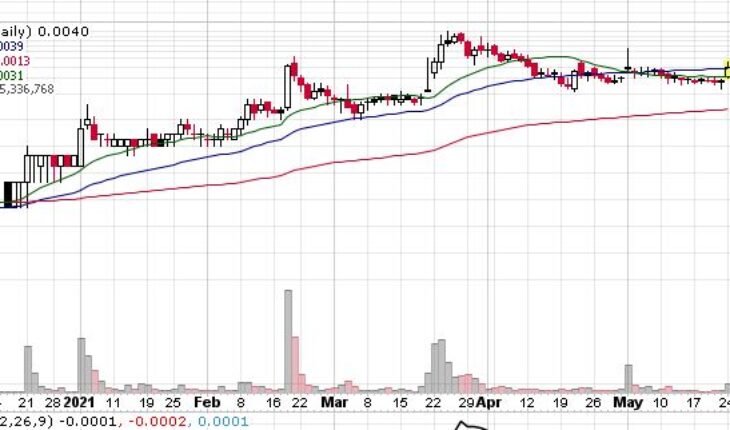
Trans Global Group Inc (OTCMKTS:TGGI) stock is moving up sharply on Monday’s trading session.
Market Action
As of 12:28, TGGI stock surged 45.35% at $0.0041. The stock has traded 412 million shares, well above its average volume of 230 million shares. The stock opened at $0.0030 and moved in a range of $0.0030 – 0.0046.
TGGI Business Description
Trans Global Group, Inc., a green company, through its subsidiaries, engages in renewable energy and solar energy sector. It offers products to reduce homeowner’s and business’ energy consumption, lower their carbon footprint, enhance the efficiency of their energy products, and reduce energy costs.
The company also provides general construction services, including building schools, condominiums, town home communities, home renovations and add-ons, housing, and other projects. In addition, it offers bonding and insurance agency services. The company was formerly known as Teletek, Inc. and changed its name to Trans Global Group, Inc. in October 2007. Trans Global Group, Inc. was incorporated in 1979 and is headquartered in Coconut Creek, Florida.
Trader Notes
Share Information
| SHARES OUTSTANDING | 7,865.58 M |
| SHARE FLOAT (%) | – |
| % HELD BY INSTITUTIONS | – |
Recent Stock Performance
| 5-DAY PERF. | +51.85% |
| 1-MONTH PERF. | +20.59% |
| 3-MONTH PERF. | +95.24% |
| 6-MONTH PERF. | +4000.00% |
| YTD PERF. | +925.00% |
| 1-YEAR PERF. | +1950.00% |
Moving Averages
| +/- EMA(20) | 0.0032 (+28.13%) |
| +/- SMA(50) | 0.0039 (+5.13%) |
| +/- SMA(200) | 0.0013 (+215.38%) |
Pivot Points
| Name | S3 | S2 | S1 | Pivot Points | R1 | R2 | R3 |
| Classic | 0.0018 | 0.0021 | 0.0024 | 0.0027 | 0.0030 | 0.0033 | 0.0036 |
| Fibonacci | 0.0021 | 0.0023 | 0.0024 | 0.0027 | 0.0029 | 0.0030 | 0.0033 |
Technical Indicators
| Symbol | Value | Result | Symbol | Value | Result |
| ADX | 42.6846 | Buy | ATR14 | 0.0007 | |
| CCI20 | -89.7436 | Sell | Chaikin Money Flow | -0.2565 | Sell |
| MACD | 0.0000 | Buy | Money Flow Index | 28.7851 | Sell |
| ROC | -20.0000 | Sell | RSI | 42.5309 | Sell |
| STOCH (14,3) | 31.2500 | Buy | STOCH RSI | 0.8063 | OverBought |
| UO | 56.4840 | Buy | Williams %R | -68.7500 | Neutral |


