CLPS Inc (NASDAQ:CLPS) is trading up, but well off session high on Monday.
Market Action
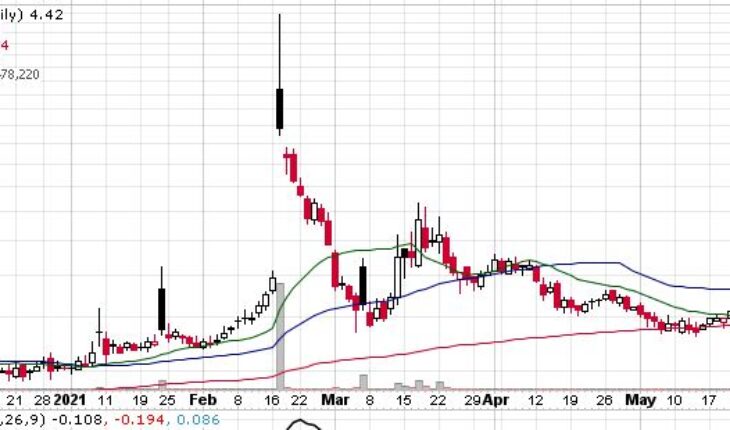
As of 10:38, CLPS stock is trading up by 6.35% to $4.37. The stock has witnessed a very unusual volume with 12.63 million shares, 10X its average volume of 1.34 million. The stock has moved within a range of $4.36 – 5.25 after opening the trade at $4.58.
CLPS Issues News Today
CLPS Incorporation Announces Strategic Cooperation with MCT, a Hong Kong Listed Company, to Develop a Next Generation Loan Trading Software
- CLPS announced a strategic cooperation with Minshang Creative Technology Holdings Limited (“MCT”, 01632.HK) to jointly develop a next generation loan trading software and to explore global financial technology services market.
- On May 18 2021, CLPS, through its wholly owned subsidiary, Growth Ring Ltd., entered into a Capital Increase Agreement (the “Agreement”) with MCT.
- Pursuant to the Agreement, CLPS will hold 53.33% ownership stake in MSCT Investment Holdings Limited (“MSCT”), a wholly-owned subsidiary of MCT, upon closing of the transaction, while MSCT will in turn own the intellectual property rights of the loan trading software of MCT.
Mr. Raymond Lin, Chief Executive Officer of CLPS, said, “We have been focused on our mergers and acquisitions initiative not only in China, but also overseas as part of our global expansion strategy. Our cooperation with MCT, which involves the subscription of majority equity stake of MSCT and the plan to optimize its loan trading software, complements our capability in developing high quality products and solutions. “
Trader Notes
Share Information
| SHARES OUTSTANDING | 19.02 M |
| SHARE FLOAT (%) | 8.10 M (42.60%) |
| % HELD BY INSTITUTIONS | 1.10 |
Recent Stock Performance
| 5-DAY PERF. | +10.35% |
| 1-MONTH PERF. | -0.23% |
| 3-MONTH PERF. | -40.05% |
| 6-MONTH PERF. | +39.98% |
| YTD PERF. | +43.75% |
| 1-YEAR PERF. | +132.45% |
Moving Averages
| +/- EMA(20) | 4.10 (+6.59%) |
| +/- SMA(50) | 4.62 (-5.41%) |
| +/- SMA(200) | 3.84 (+13.80%) |
Pivot Points
| Name | S3 | S2 | S1 | Pivot Points | R1 | R2 | R3 |
| Classic | 3.8167 | 3.8933 | 3.9967 | 4.0733 | 4.1767 | 4.2533 | 4.3567 |
| Fibonacci | 3.8933 | 3.9621 | 4.0046 | 4.0733 | 4.1421 | 4.1846 | 4.2533 |
Technical Indicators
| Symbol | Value | Result | Symbol | Value | Result |
| ADX | 35.6410 | Buy | ATR14 | 0.3366 | |
| CCI20 | 20.7592 | Neutral | Chaikin Money Flow | 0.0145 | Neutral |
| MACD | -0.1350 | Sell | Money Flow Index | 43.8797 | Buy |
| ROC | 4.5918 | Buy | RSI | 46.0795 | Buy |
| STOCH (14,3) | 90.9091 | OverBought | STOCH RSI | 0.9582 | OverBought |
| UO | 65.1020 | Buy | Williams %R | -9.0909 | OverBought |
