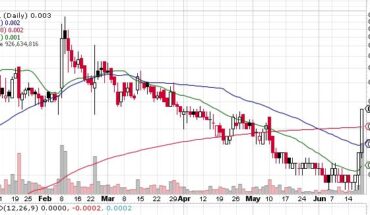
Glory Star New Media Group Holdings Limited (NASDAQ:GSMG) will continue to bleed in today’s session?
Stock Movement
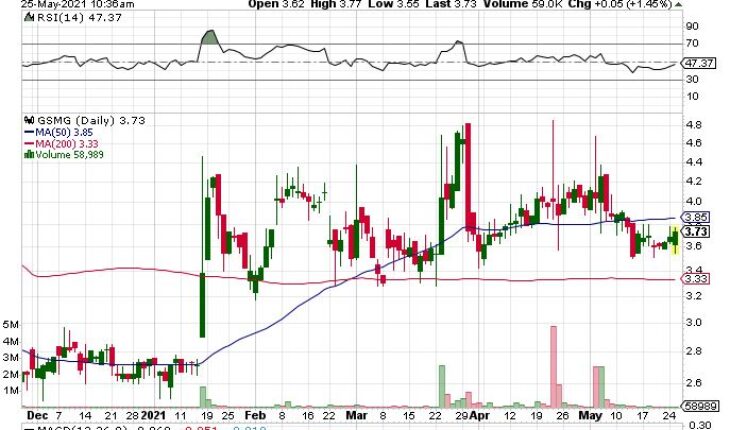
At 9:48 GSMG is trading at $3.57 after declining 2.99% on Tuesday morning. Volume is 24.8k shares. GSMG opened at 3.62 and has traded in a range between 3.55 and 3.71.
Glory Star’s Announcement
GSMG announced the commencement of the commercial applications of its blockchain and non-fungible token (NFT) technologies through its digital copyright management platform.
The commencement will help GSMG explore business opportunities in NFT assets, opening new revenue streams
According to the latest data from nonfungible.com, the value of the entire NFT market has grown from less than $41 million three years ago to $338 million at the end of 2020, representing an increase of 724%.
Glory Star’s Platform has been put to use in the Company’s copyright management system for its CHEERS video platform, as well as the SaaS, point-redemption, and live-event modules for its CHEERS e-Mall.
Bing Zhang, Founder of Glory Star, states, “Going forward, new applications for blockchain technology will be an important focus for us to promote rapid growth, not only for Glory Star, but for the entire digital content industry as well.”
Last week, GSMG renewal of its cooperation agreement with E-Surfing Media Co., Ltd
Trader Notes
Pivot Points
| Name | S3 | S2 | S1 | Pivot Points | R1 | R2 | R3 |
| Classic | 3.4633 | 3.5467 | 3.6133 | 3.6967 | 3.7633 | 3.8467 | 3.9133 |
| Fibonacci | 3.5467 | 3.6040 | 3.6394 | 3.6967 | 3.7540 | 3.7894 | 3.8467 |
Technical Indicators
| Symbol | Value | Result | Symbol | Value | Result |
| ADX | 26.5990 | Buy | ATR14 | 0.2355 | |
| CCI20 | -60.3831 | Sell | Chaikin Money Flow | -0.0469 | Neutral |
| MACD | -0.0722 | Sell | Money Flow Index | 8.2793 | OverSold |
| ROC | -6.1224 | Sell | RSI | 46.3485 | Buy |
| STOCH (14,3) | 20.4545 | Buy | STOCH RSI | 1.0000 | OverBought |
| UO | 50.5443 | Buy | Williams %R | -79.5455 | Neutral |
Moving Averages
| +/- EMA(20) | 3.77 (+0.00%) |
| +/- SMA(50) | 3.85 (-2.08%) |
| +/- SMA(200) | 3.33 (+13.21%) |
Recent Stock Performance
| 5-DAY PERF. | +2.17% |
| 1-MONTH PERF. | -2.84% |
| 3-MONTH PERF. | +0.26% |
| 6-MONTH PERF. | +41.19% |
| YTD PERF. | +37.09% |
| 1-YEAR PERF. | +8.02% |
Share Information
| SHARES OUTSTANDING | 66.08 M |
| SHARE FLOAT (%) | 22.11 M (33.46%) |
| % HELD BY INSTITUTIONS | 0.26 |
Bottom Line
GSMG needs to pull up its sleeves. After touching a high of $4.38 on May 5, the stock has been trending lower. The last 10 sessions the stock has traded sideways. Bulls really need to see the stock break above the 3.78 area. Will it break the $4 mark and move higher in the coming weeks remains to be seen.
